 Click to zoom
Custom Bar Table Charts for Keynote: Elevate Your Data Storytelling
| Format | .pptx |
| Slides | 14 unique layouts |
| Aspect ratio | 16:9 |
| Compatibility | PowerPoint |
| Animated | No |
| Language | English |
| License | Commercial |
| File size | — |
| Version | v1.0 |
| Last updated | February 2023 |
What's inside
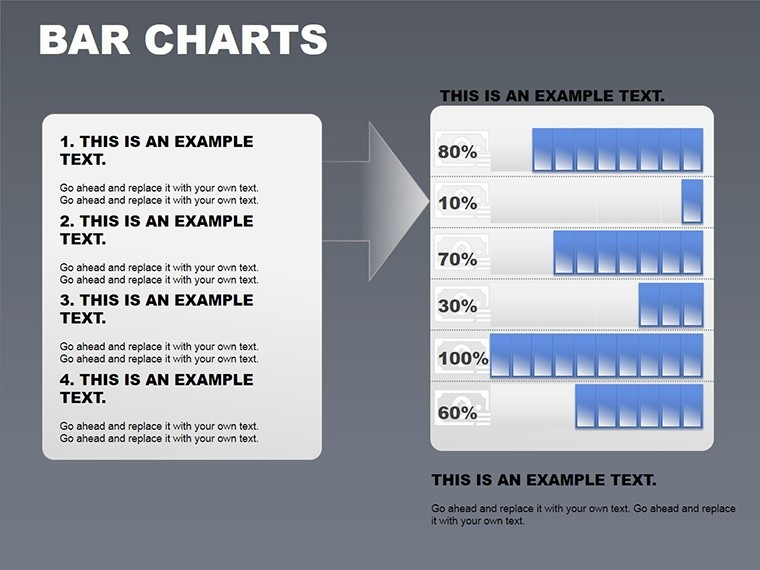
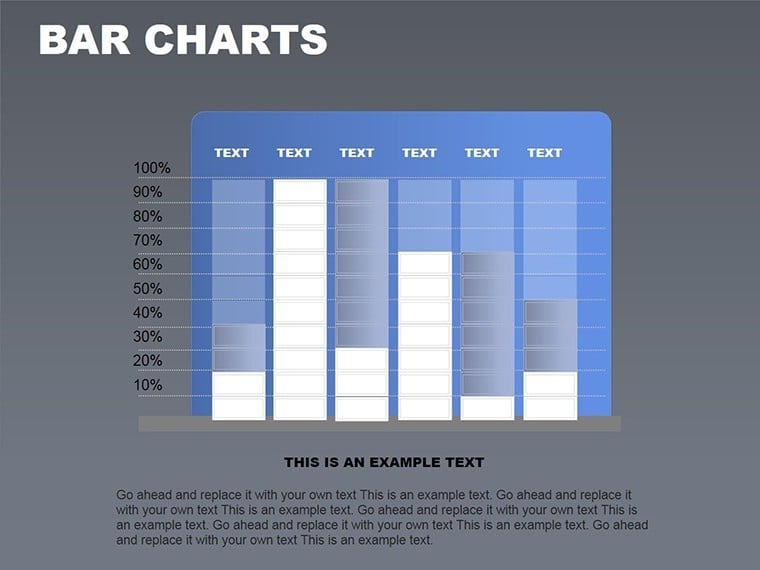
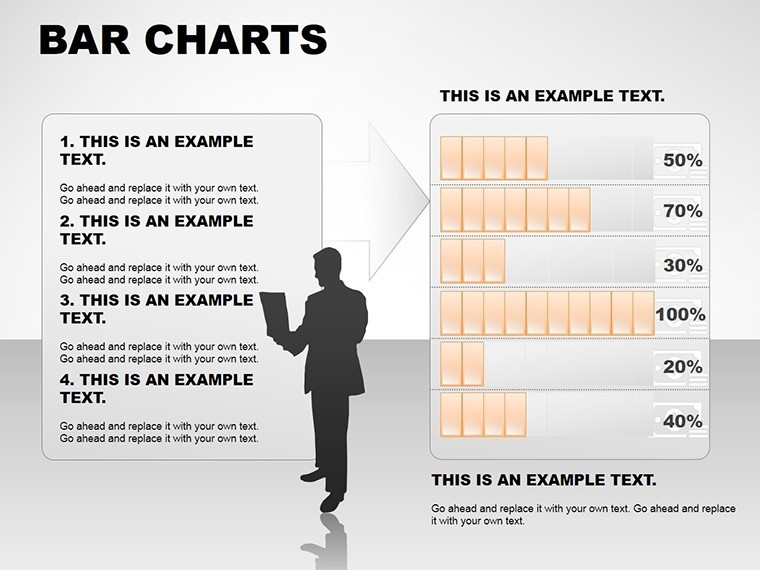
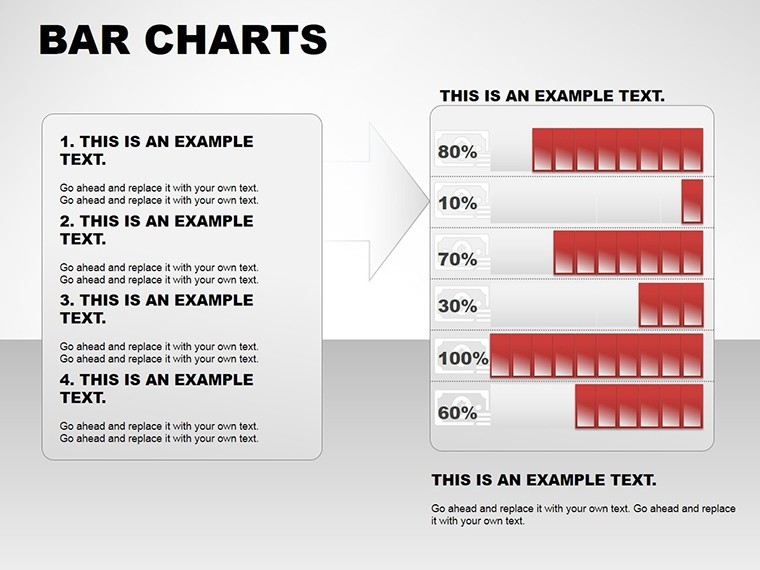
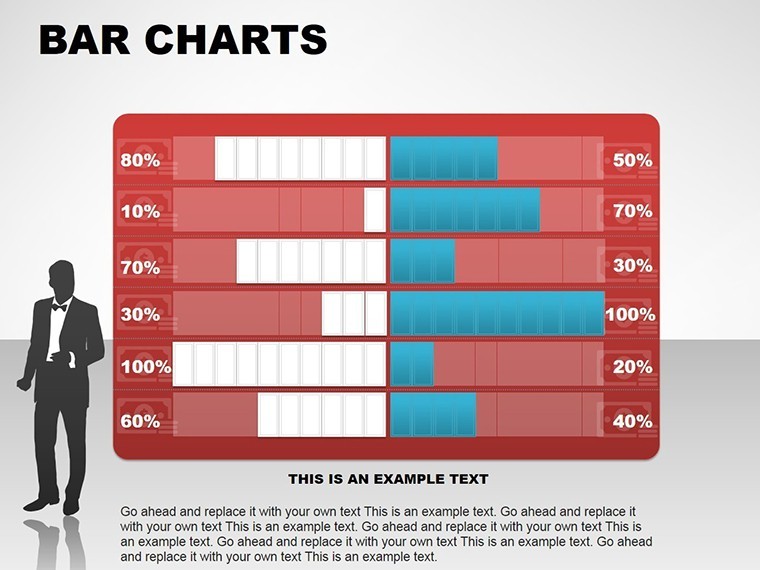
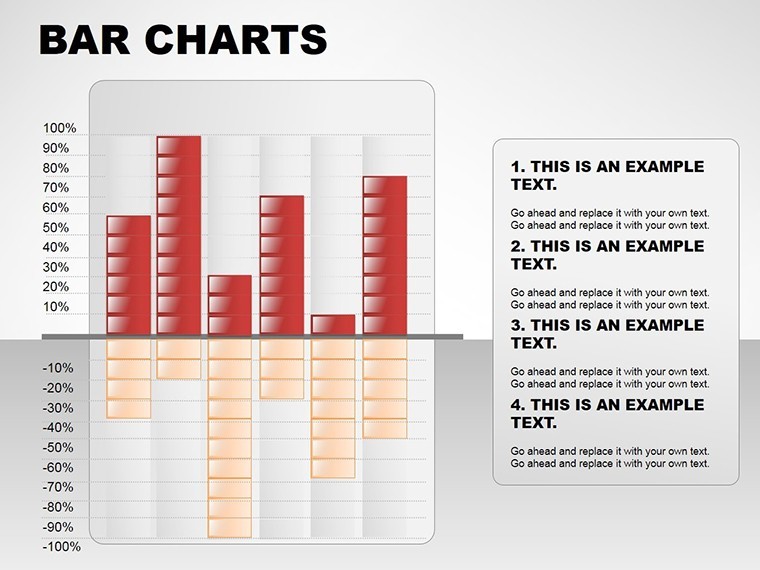
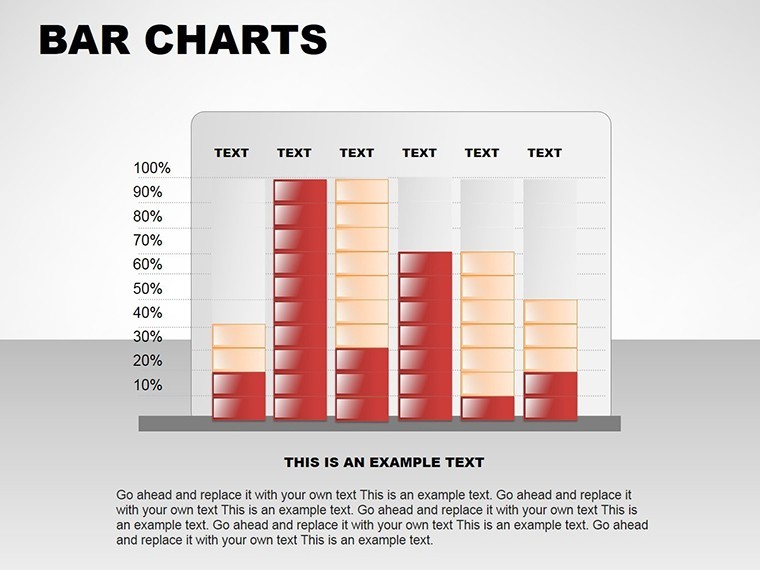
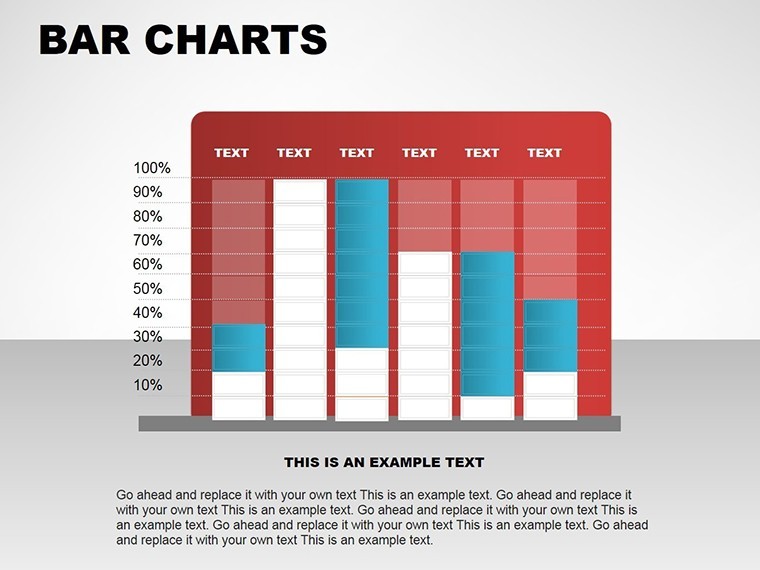
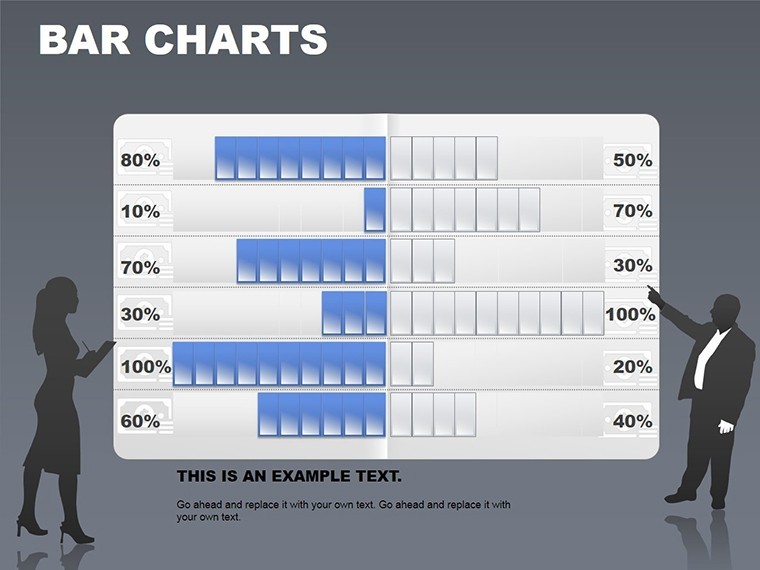
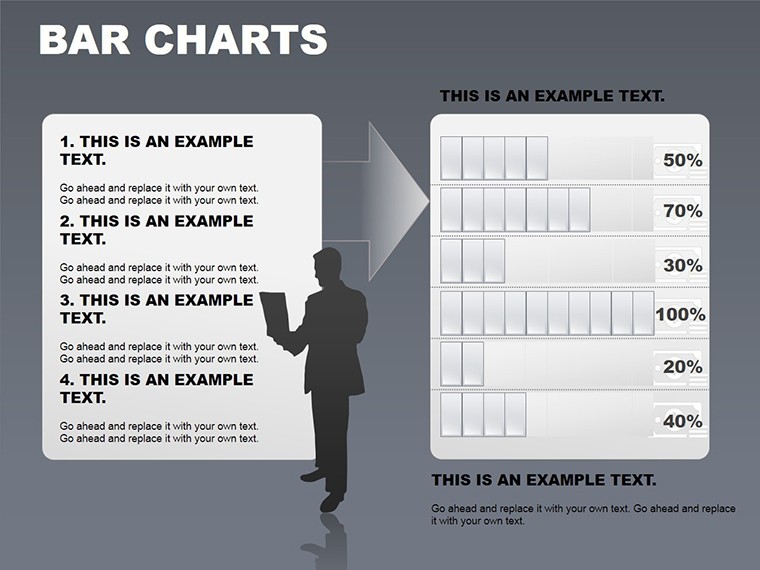
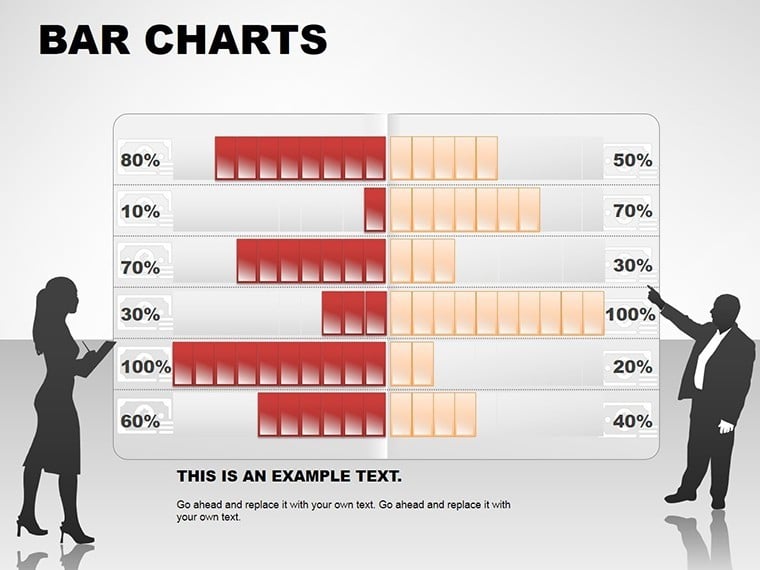
In the fast-paced world of business and data analysis, presenting information in a way that sticks with your audience is key to success. Imagine turning dry sales figures or complex market trends into visually compelling stories that drive decisions and inspire action. That's exactly what our Bar Table Keynote Charts Template offers. Designed specifically for Apple's Keynote software, this template provides 14 fully editable slides packed with versatile bar table designs. Whether you're a marketing professional preparing a quarterly report, a researcher sharing survey insights, or a project manager highlighting performance metrics, this tool empowers you to communicate with clarity and impact.
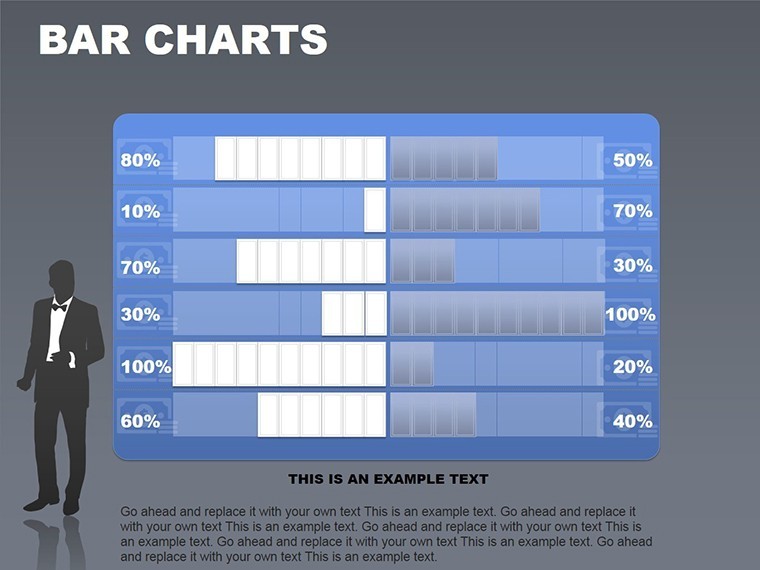
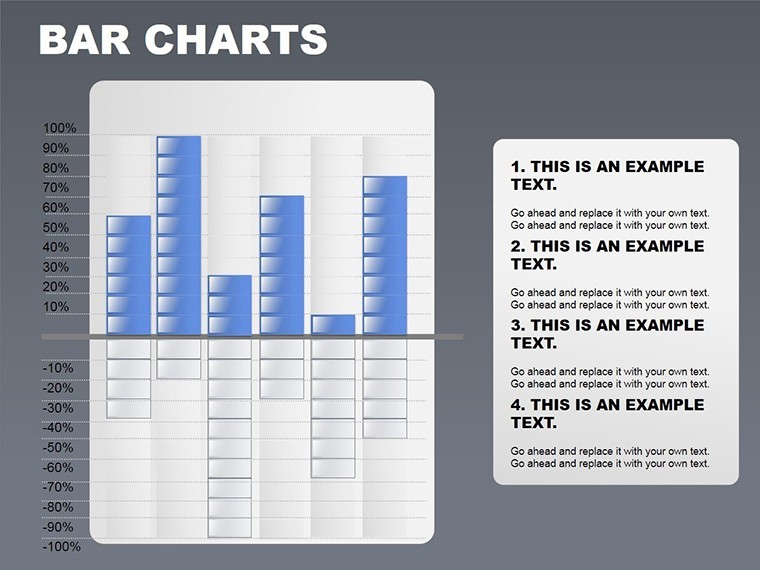
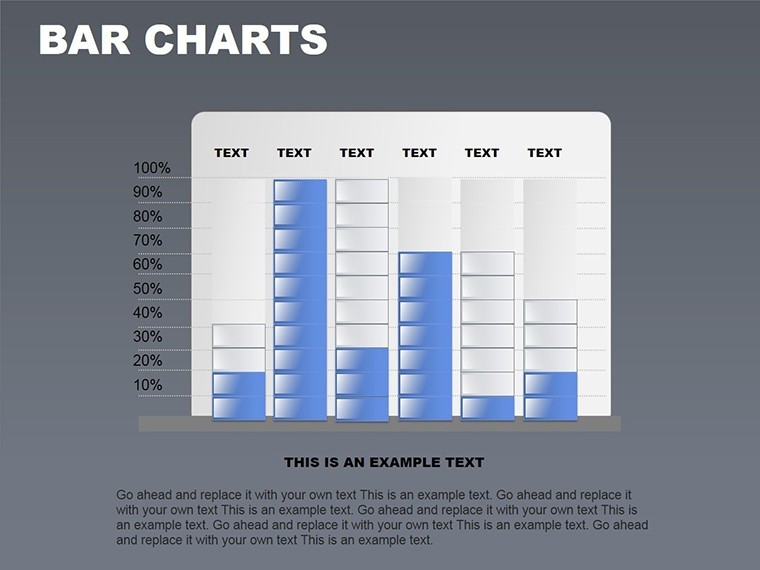
At its core, this template bridges the gap between raw data and meaningful narratives. With options for vertical, horizontal, stacked, and grouped bars, you can adapt each chart to fit your specific dataset. Customization is effortless - adjust colors to match your brand palette, tweak fonts for readability, or resize elements to emphasize key points. No more starting from scratch or wrestling with default tools that fall short. This template saves hours of design time while ensuring your presentations look polished and professional, helping you stand out in meetings, pitches, or conferences.
Unlocking the Power of Bar Table Visualizations
Bar tables aren't just about plotting numbers; they're about revealing patterns and comparisons that might otherwise go unnoticed. Consider a sales team analyzing regional performance: using stacked bars, you can layer data on product categories to show how each contributes to overall revenue. Or, in a market research context, grouped bars allow side-by-side comparisons of consumer preferences across demographics. This template's intuitive interface lets you drag and drop data directly into the charts, with automatic scaling that maintains accuracy and aesthetics.
Beyond basic functionality, the template incorporates advanced features like dynamic labels and legends. These elements provide context without cluttering the slide, ensuring your audience grasps the insights at a glance. For instance, in a survey results presentation, color-coded bars can highlight satisfaction levels, with tooltips offering deeper explanations on hover. This level of detail aligns with best practices in data visualization, drawing from principles outlined by experts like Edward Tufte, who emphasize "graphical excellence" through clear, precise displays.
Key Features That Set This Template Apart
- Versatile Layouts: Choose from vertical bars for trend tracking, horizontal for category comparisons, stacked for part-to-whole relationships, and grouped for multi-series data.
- Full Customization: Edit columns, rows, colors, fonts, and positions to tailor each chart to your narrative.
- Data Integration: Seamlessly import from spreadsheets or input manually, with real-time updates.
- Accessibility Enhancements: Built-in options for alt text on charts and high-contrast modes, adhering to WCAG guidelines for inclusive presentations.
- Animation Support: Add subtle animations to reveal data progressively, keeping your audience engaged.
These features aren't generic - they're honed for real-world applications. Take a financial analyst preparing an earnings call: using this template, they can create a bar table showing year-over-year growth, with stacked elements breaking down revenue streams. The result? A slide that not only informs but persuades stakeholders to invest confidently.
Real-World Applications: From Boardrooms to Classrooms
Dive deeper into how this Bar Table Keynote Charts Template transforms everyday tasks. In corporate settings, it's invaluable for KPI dashboards. Picture a tech startup pitching to investors: horizontal bars compare user acquisition costs across channels, clearly demonstrating efficiency. This visual punch can be the difference between securing funding or walking away empty-handed.
Educators also benefit immensely. Teaching statistics? Use grouped bars to illustrate probability distributions, making abstract concepts tangible. Students respond better to visuals that simplify complexity, as supported by cognitive load theory in educational psychology. Similarly, in non-profits, bar tables can showcase impact metrics, like donation trends over time, fostering donor trust and encouraging contributions.
For healthcare professionals, visualizing patient outcomes or resource allocation becomes straightforward. Stacked bars might depict treatment efficacy across age groups, aiding in evidence-based decision-making. This template's flexibility extends to creative fields too - designers can use it for portfolio metrics, showing project timelines or client satisfaction scores in an aesthetically pleasing format.
Step-by-Step Guide to Maximizing Your Template
- Select Your Layout: Open Keynote, choose the template, and pick a bar style that suits your data.
- Input Data: Populate the table with your figures - watch as bars auto-adjust.
- Customize Aesthetics: Align colors with your theme, add labels for clarity.
- Add Interactivity: Incorporate hyperlinks or animations for dynamic presentations.
- Review and Refine: Preview in slideshow mode, tweak for optimal flow.
Following these steps ensures your presentation isn't just seen but remembered. Compared to basic Keynote tools, this template offers pre-built sophistication, reducing errors and enhancing professionalism. It's like having a design consultant at your fingertips.
Tips for Effective Data Presentation
To truly leverage this template, embrace design best practices. Avoid overcrowding - limit to 5-7 bars per chart for readability. Use contrasting colors thoughtfully; for example, blues for calm data sets like market stability, reds for alerts like declining sales. Incorporate storytelling: start with an overview slide using a simple bar table, then drill down in subsequent ones.
Integrate with other Keynote elements for a cohesive deck. Pair bar tables with text boxes for narratives or images for context. In a case study from a Fortune 500 company, similar visualizations led to a 20% increase in meeting engagement, as reported in Harvard Business Review articles on data-driven communication.
Workflow integration is seamless. Export to PDF for sharing or embed in reports. For teams, collaborative editing in iCloud means real-time updates, perfect for agile environments.
Why Choose This Template for Your Next Presentation?
In a sea of mediocre slides, stand out with visuals that inform and inspire. This Bar Table Keynote Charts Template isn't just a file - it's a gateway to better communication. Whether you're aiming to close deals, educate teams, or report progress, it delivers value every time.
Ready to revolutionize your data displays? Customize your presentations today and see the difference.
Frequently Asked Questions
How customizable are the bar tables in this template?
The bar tables are fully editable, allowing changes to data, colors, sizes, and layouts to fit your needs perfectly.
Is this template compatible with older versions of Keynote?
Yes, it works with Keynote versions from 6.0 onward, ensuring broad accessibility for users.
Can I use this for non-business purposes?
Absolutely - it's versatile for education, personal projects, or any scenario needing clear data visualization.
What file formats can I export the finished presentation to?
You can export to PDF, PowerPoint, images, or video, making sharing effortless.
Are there tutorials included?
While not bundled, our site offers free guides on advanced customization techniques.
Good for
- Project roadmaps and sprint plans
- Product launch timelines
- Quarterly or annual review decks
- Company history and milestone summaries
Licence
reviews
Used this for an investor update and the charts were easy to edit.
Some colors clashed a little on projector.
The layouts helped organize financial numbers.
Pretty decent for last minute work.
I liked the clean spacing.
FAQ
Will it work in Google Slides?
Are fonts embedded?
Can I use this for client work?
What's the refund policy?
Do you update the template after purchase?
Similar templates
See all Keynote Charts →
All 14 slides