 Click to zoom
Corporate Social Responsibility Keynote Charts: Visualize Impact and Ethics Effortlessly
| Format | .pptx |
| Slides | 30 unique layouts |
| Aspect ratio | 16:9 |
| Compatibility | PowerPoint |
| Animated | No |
| Language | English |
| License | Commercial |
| File size | — |
| Version | v1.0 |
| Last updated | January 2025 |
What's inside
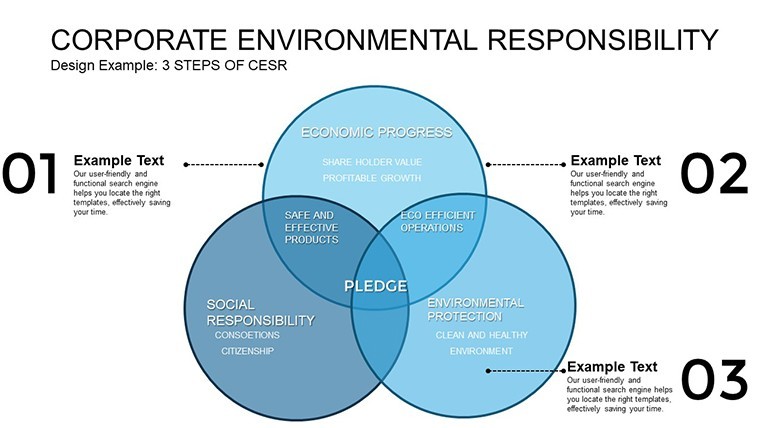
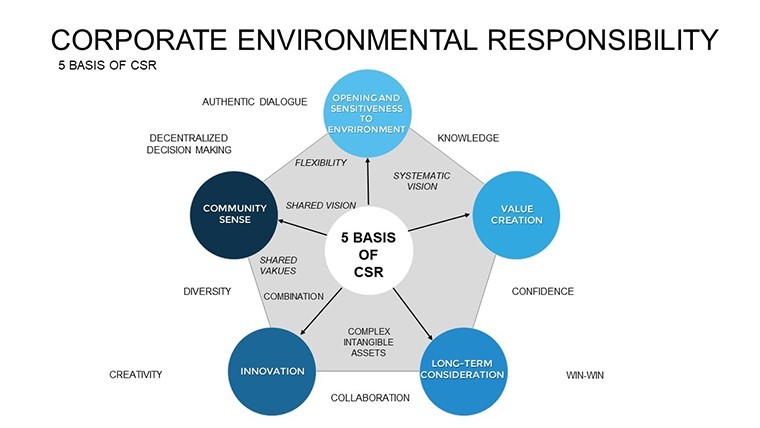
In an era where businesses are judged not just by profits but by their positive footprint on society, presenting Corporate Social Responsibility (CSR) initiatives demands more than words - it requires vivid, credible visuals that resonate. Our CSR Keynote Charts and Diagrams Template delivers exactly that, with 30 meticulously designed, editable slides tailored for sustainability managers, corporate communicators, and nonprofit leaders. From pie charts dissecting environmental contributions to flow diagrams mapping ethical supply chains, this template turns complex CSR data into engaging stories that build trust and inspire action.
Picture this: You're at a stakeholder meeting, unveiling your company's journey toward carbon neutrality. Instead of dense text, you showcase a bar graph highlighting emission reductions year-over-year, complemented by icons of trees and recycling symbols. This isn't just data; it's a narrative of commitment. Crafted for Keynote users, the template supports quick customizations, ensuring your visuals align with brand guidelines while adhering to global standards like the UN Sustainable Development Goals (SDGs).
Essential Features for CSR Storytelling
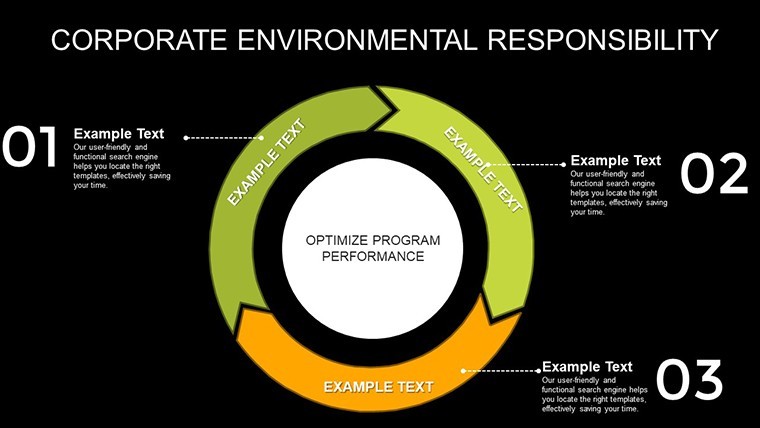
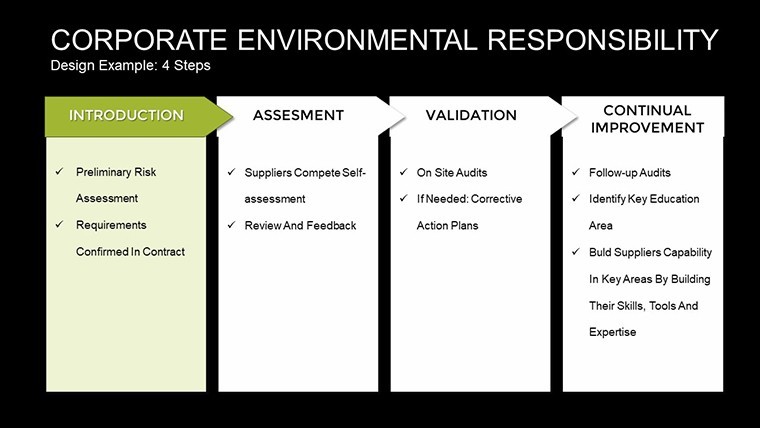
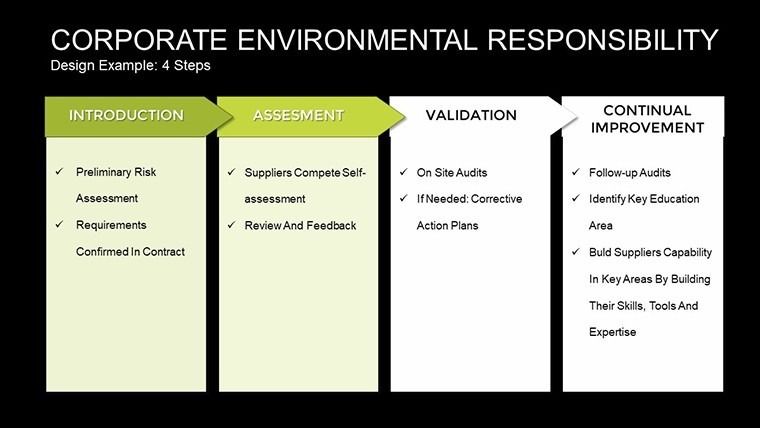
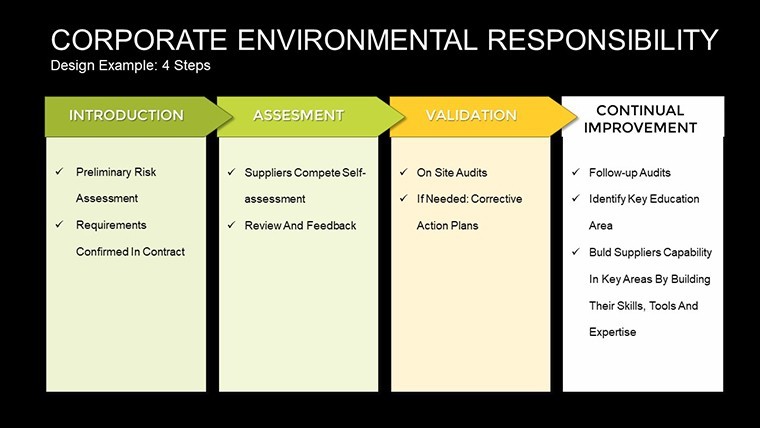
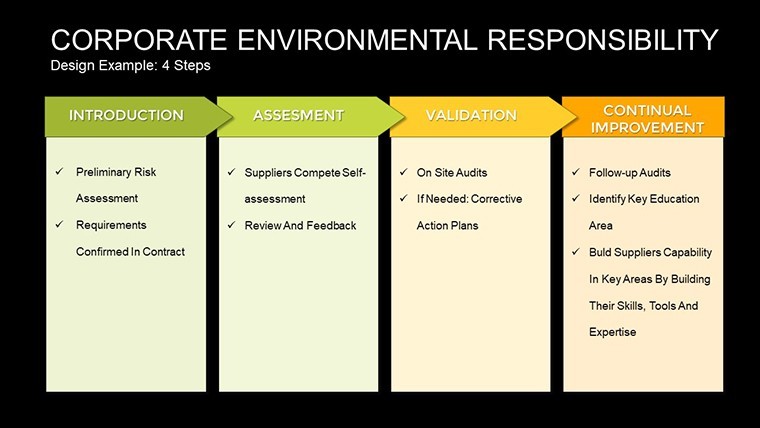
At the heart of this template are diverse diagram types optimized for CSR themes. Pie charts excel in breaking down budget allocations, such as percentages devoted to community outreach versus employee wellness programs. Bar graphs compare metrics like volunteer hours across departments, while flow diagrams illustrate processes, from ethical sourcing to waste reduction strategies. Each slide incorporates thematic elements - think earth tones and subtle animations - to evoke responsibility without overwhelming.
The editable framework allows for deep personalization: swap data sets, adjust scales, or integrate photos from your initiatives, like a community cleanup event. With widescreen compatibility, these slides shine in virtual webinars or boardroom projections. For those in sustainability consulting, leverage these tools to demonstrate compliance with ISO 26000 standards, adding layers of authoritativeness to your pitches.
- Thematic Consistency: Pre-set color schemes inspired by nature, promoting a cohesive look across all slides.
- Data Integrity: Built-in grids and guides ensure accurate representations, avoiding common pitfalls in CSR reporting.
- Integration Ease: Pull data from CSR software like Enablon or custom spreadsheets for real-time updates.
- Engagement Boosters: Interactive elements like clickable legends for deeper dives into metrics.
Practical Use Cases with Expert Insights
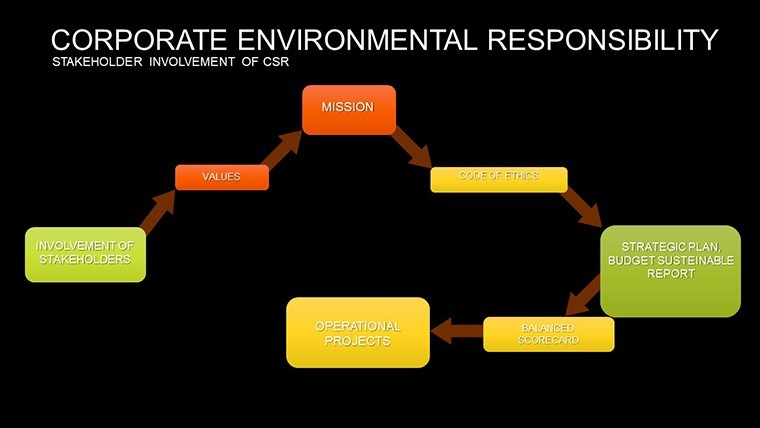
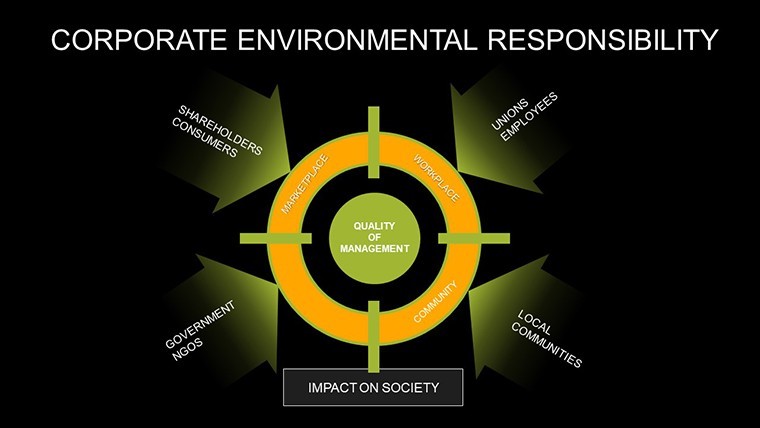
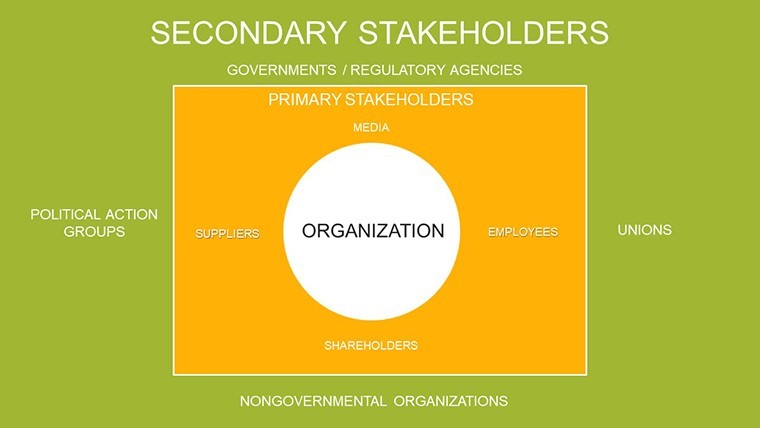
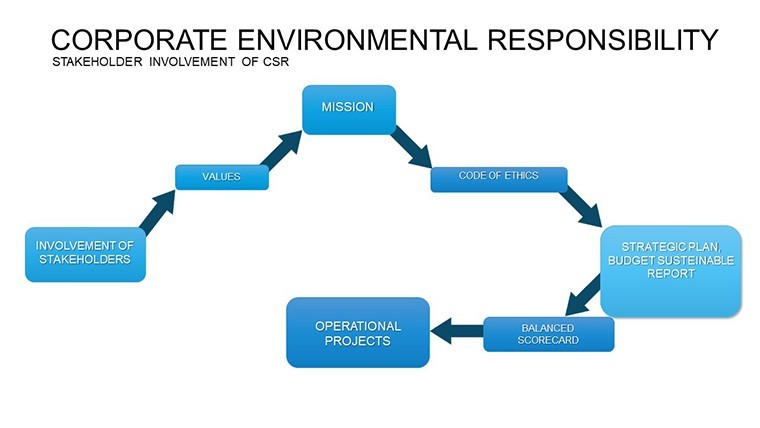
For annual CSR reports, use flow diagrams to outline stakeholder engagement processes, mirroring best practices from companies like Patagonia, where transparency drives brand loyalty. In internal meetings, bar charts can track progress on diversity initiatives, drawing from HR benchmarks like those from SHRM. Sustainability campaigns benefit from pie charts showing impact areas, such as water conservation efforts in manufacturing - echoing case studies from Unilever's sustainable living plan.
Nonprofits might adapt these for grant proposals, visualizing program outcomes to funders. One real-world example: A consulting firm used similar diagrams to help a client achieve B Corp certification, with visuals proving ethical operations and boosting investor interest. These applications underscore the template's role in not just presenting data but fostering meaningful dialogues on corporate ethics.
Workflow for Seamless CSR Presentations
- Start with Setup: Download the .key file and import your CSR metrics from annual audits.
- Build Visuals: Choose a diagram, input values - watch as proportions auto-adjust for accuracy.
- Enhance with Details: Add narratives, like explaining a graph's dip due to pandemic challenges, then recovery via adaptive strategies.
- Refine and Rehearse: Apply transitions, test on multiple devices, and incorporate feedback for polished delivery.
- Deploy and Measure: Present, then analyze audience responses to iterate future reports.
This structured approach aligns with GRI reporting frameworks, ensuring your visuals are not only beautiful but verifiable. Integrate with tools like Power BI for advanced analytics or Canva for supplementary graphics, creating a holistic CSR communication ecosystem.
Advantages Compared to Generic Diagrams
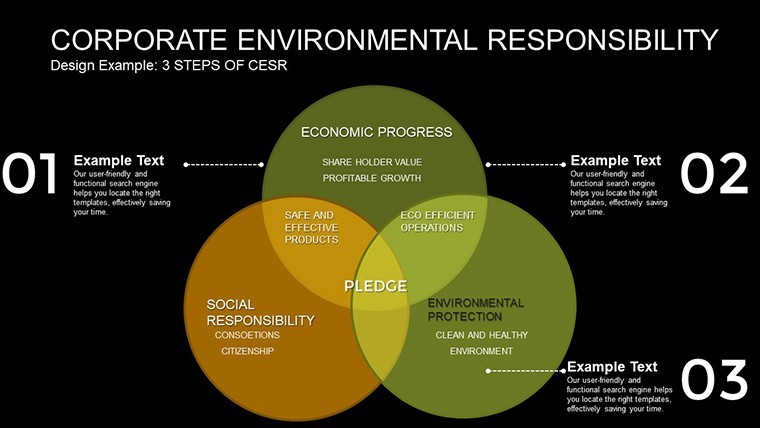
Unlike standard Keynote offerings, this template embeds CSR-specific icons - solar panels, community hands - enhancing relevance and emotional appeal. It promotes better comprehension, with studies from Harvard Business Review showing visualized ethics reports increase stakeholder engagement by up to 30%. For ethical practices, ensure diagrams reflect triple bottom line (people, planet, profit), avoiding greenwashing accusations through transparent data sourcing.
The logical progression - from overview diagrams to detailed breakdowns - mirrors effective storytelling techniques advocated by experts like Simon Sinek, starting with 'why' your CSR matters before delving into 'how'.
Pro Tips for Impactful CSR Visuals
Elevate your diagrams by layering qualitative insights, such as quotes from beneficiaries alongside quantitative charts. Opt for accessible designs, using high-contrast colors per ADA guidelines. Reference credible sources like the World Economic Forum's ESG metrics to substantiate claims. In community-focused slides, incorporate maps via flow diagrams to show geographic impact, as seen in IKEA's sustainability reports.
For employee well-being presentations, use bar graphs to benchmark against industry averages from Gallup surveys. These strategies, drawn from seasoned CSR professionals, turn your Keynote into a catalyst for change, fostering a culture of responsibility.
Embrace this template to not only report on CSR but to champion it - transforming obligations into opportunities for genuine connection and progress.
Frequently Asked Questions
What makes these charts ideal for CSR?They focus on sustainability themes with specialized diagrams for environmental and ethical data, ensuring relevant, impactful visuals.Can I integrate external data sources?Yes, easily import from Excel, Google Sheets, or CSR tools for dynamic, up-to-date presentations.Are the slides mobile-friendly?Absolutely, widescreen format adapts to iPads and phones, perfect for on-the-go reviews.Does it support team collaboration?Keynote's sharing features allow multiple editors, ideal for cross-department CSR teams.How do I ensure data accuracy?Built-in validation and guides help maintain precision, aligning with reporting standards like GRI.Is customization beginner-friendly?Yes, intuitive interfaces make edits straightforward, even for non-designers.Good for
- Project roadmaps and sprint plans
- Product launch timelines
- Quarterly or annual review decks
- Company history and milestone summaries
Licence
reviews
This helped me finish a client presentation before the deadline.
The graphs and icons looked simple enough for business use.
A couple layouts were too crowded for my taste.
I changed the fonts and it instantly looked better.
FAQ
Will it work in Google Slides?
Are fonts embedded?
Can I use this for client work?
What's the refund policy?
Do you update the template after purchase?
Similar templates
See all Keynote Charts →
All 30 slides