 Click to zoom
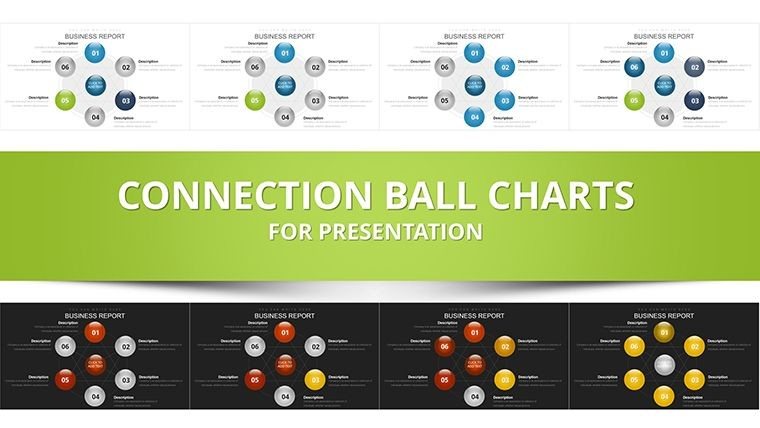
Connected Balls Charts Template for PowerPoint - 25 Slides
| Format | .pptx |
| Slides | 25 unique layouts |
| Aspect ratio | 16:9 |
| Compatibility | PowerPoint |
| Animated | No |
| Language | English |
| License | Commercial |
| File size | — |
| Version | v1.0 |
| Last updated | December 2025 |
What's inside
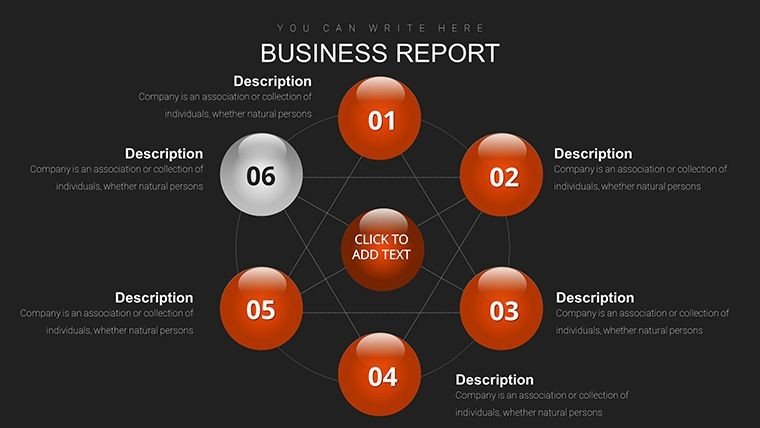
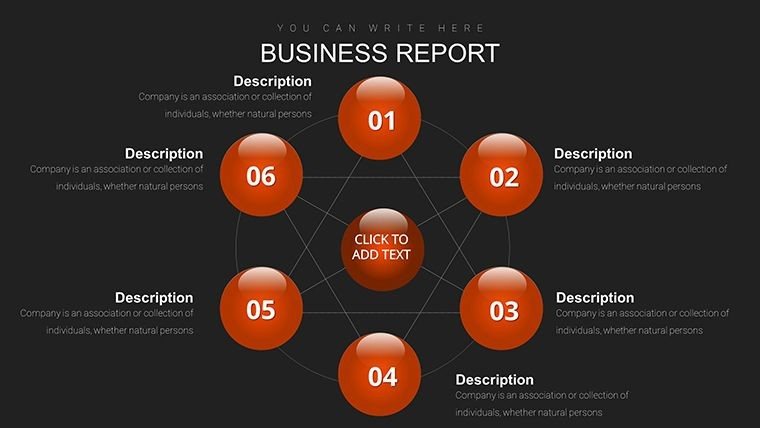
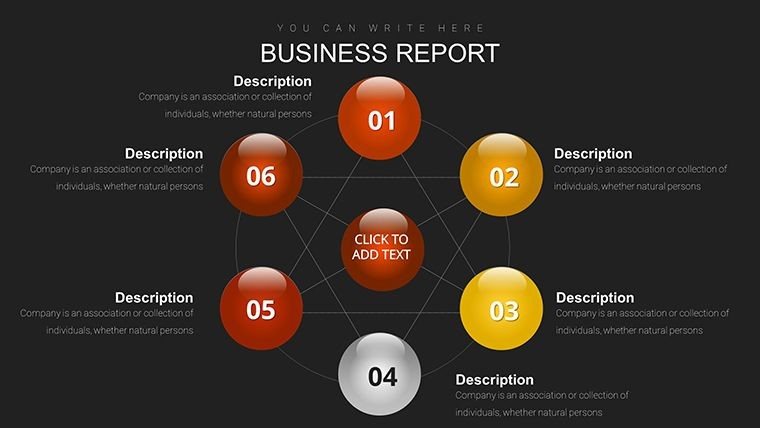
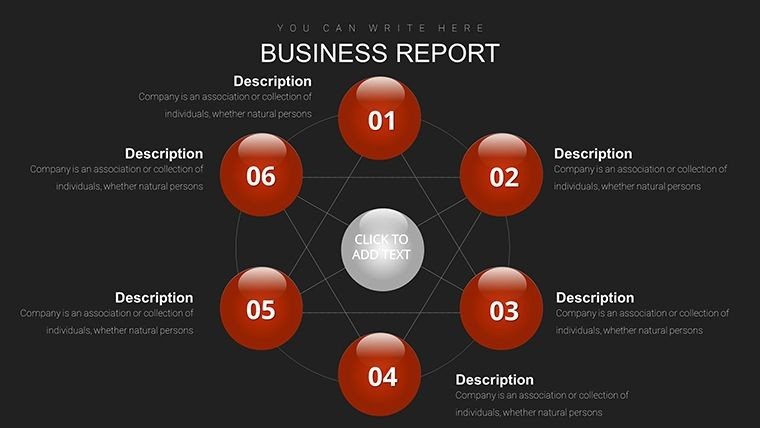
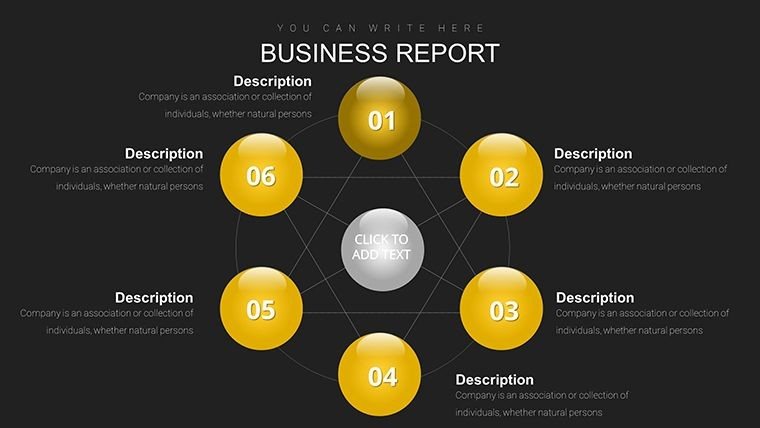
As a presentation consultant who's built hundreds of decks for Fortune 500 executives and university professors, I know the challenge of making intricate connections crystal clear without overwhelming your audience. This connected balls PowerPoint template solves that by using intuitive spherical nodes linked by dynamic lines, turning abstract relationships into visual maps that stick. With 25 fully editable slides, it streamlines your workflow, letting you focus on insights rather than design headaches.
Whether you're mapping out team dynamics for a board meeting or diagramming ecological systems in a lecture, this template delivers professional polish right out of the box. It draws on proven visualization techniques to reduce audience confusion and boost retention, based on my weekly client sessions where such tools have cut presentation prep time significantly.
In-Depth Look at Each Slide Group
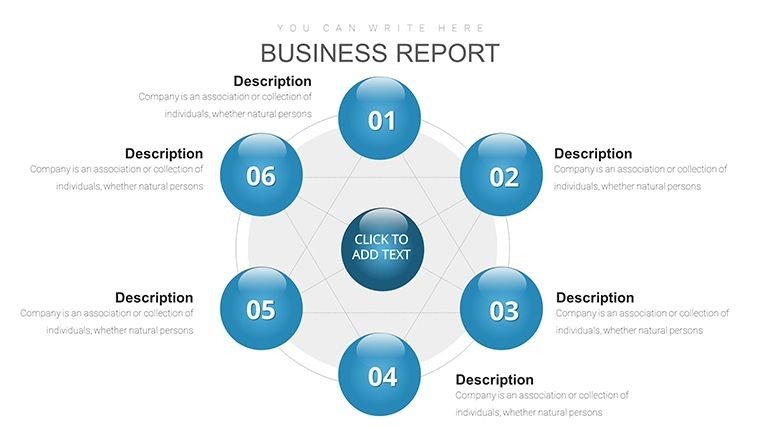
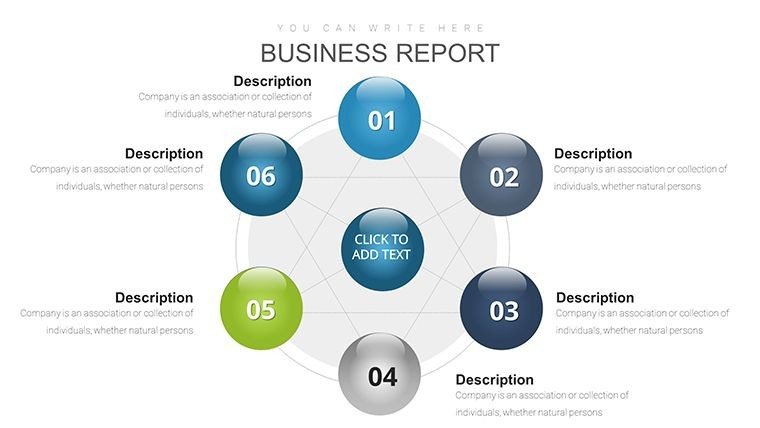
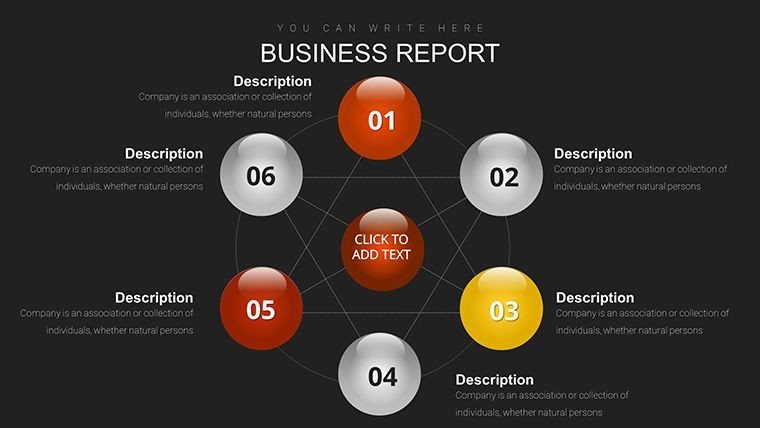
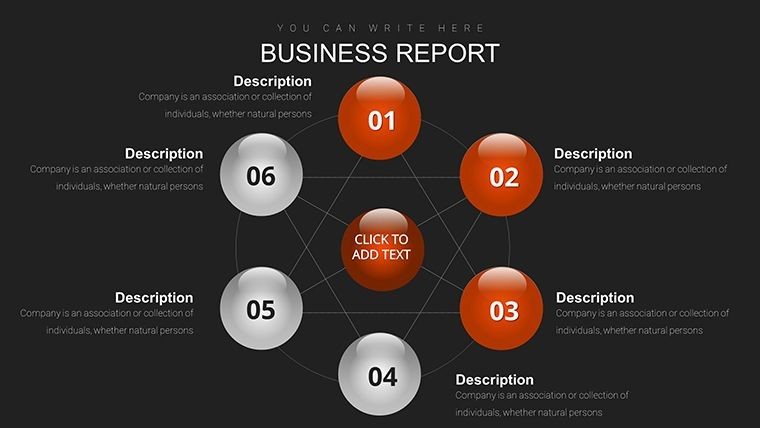
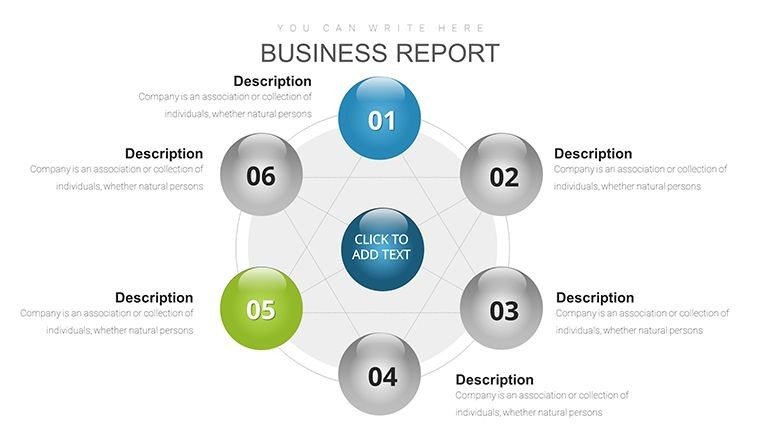
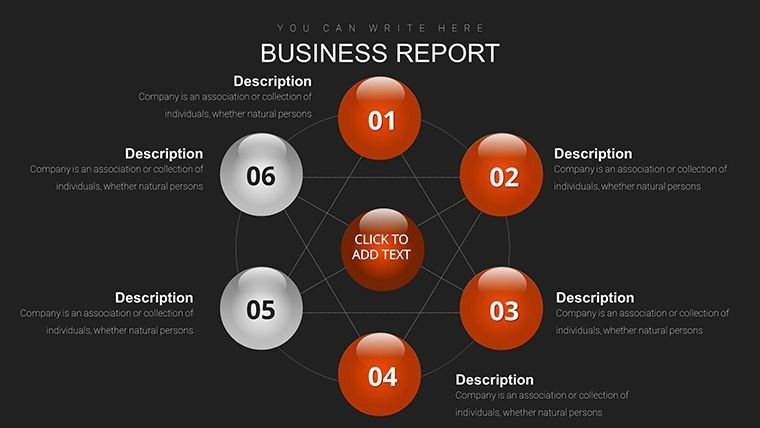
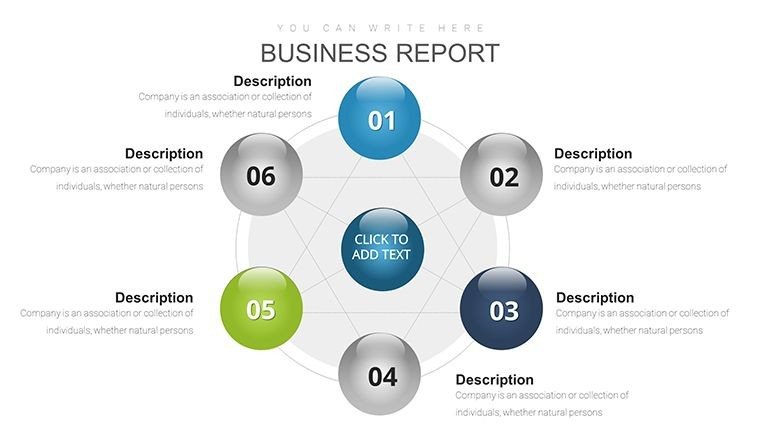
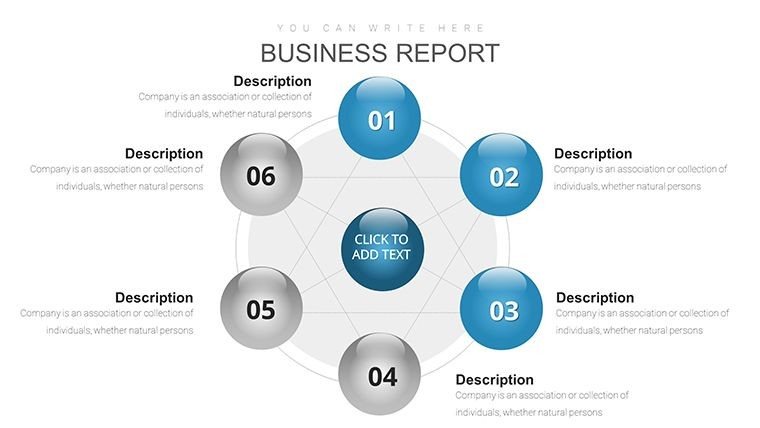
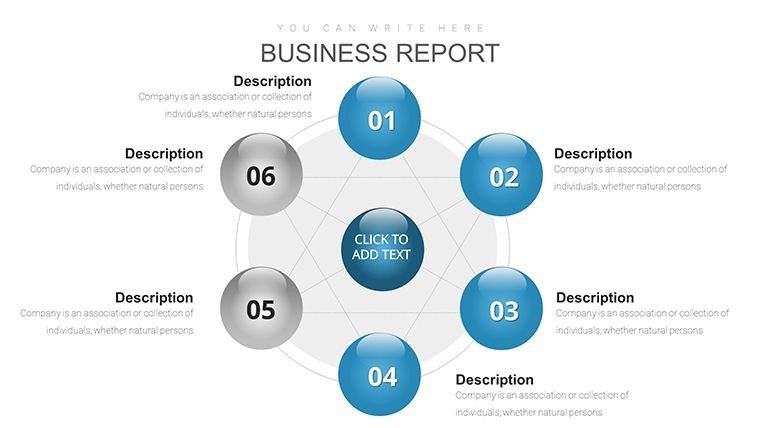
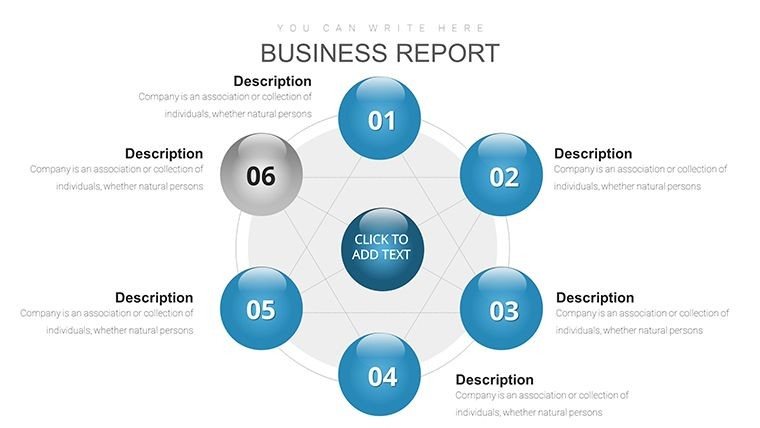
The template is organized into logical groups, each tailored to specific visualization needs. Starting with the fundamentals, slides 1 through 5 feature basic cycle charts that loop spherical elements to depict repeating sequences, like annual revenue cycles or curriculum progressions. These include customizable arrow directions and node labels for precise narrative control.
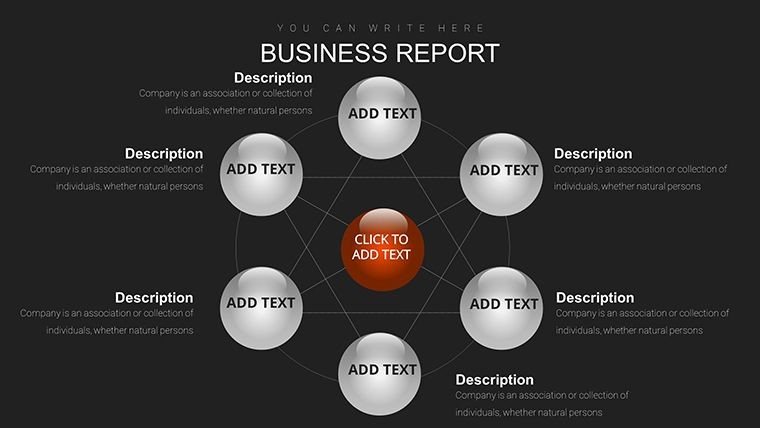
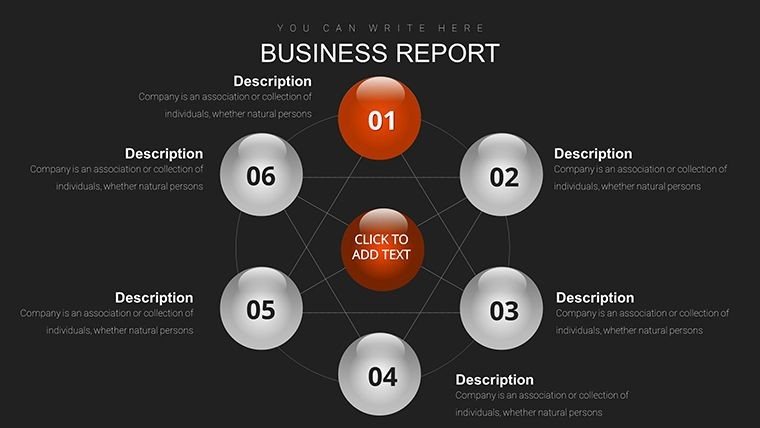
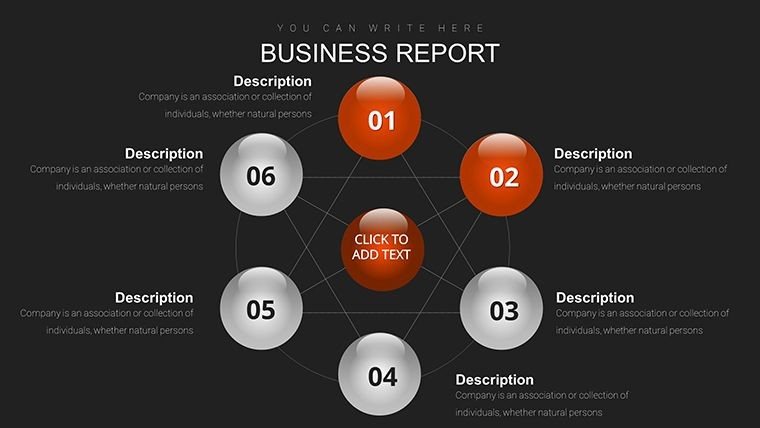
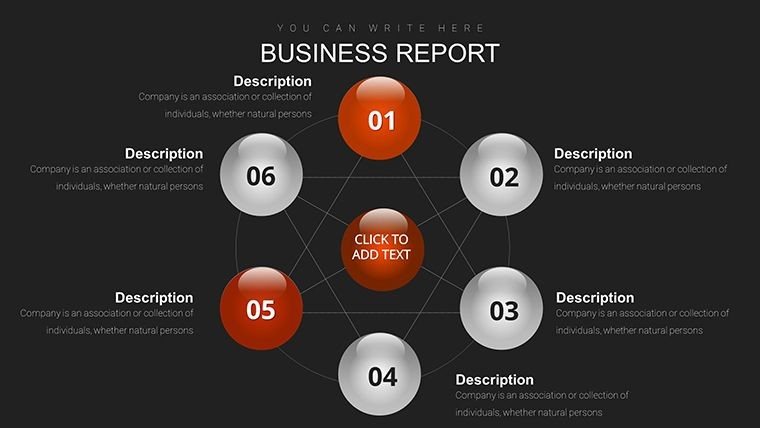
Moving to more complex structures, slides 6 to 15 offer relationship mappings where balls stand for key entities - think departments in a corporate structure - connected by adjustable lines that indicate interaction strength or hierarchy levels. I've used these in investor pitches to show partnership webs, making abstract alliances tangible and memorable.
Slides 16 to 20 integrate pie charts within the balls, allowing nested data views such as regional sales breakdowns inside a global network diagram. This layered approach is ideal for analysts presenting multifaceted metrics without switching slides excessively.
Finally, slides 21 to 25 provide hybrid placeholders for bespoke creations, with drag-and-drop zones for Excel data imports and vector elements that scale flawlessly for any screen size.
Professional Applications in Daily Practice
In boardrooms, this template shines for executives outlining strategic alliances, where connected nodes reveal dependency chains that inform decision-making. For educators, it simplifies teaching interconnected concepts like historical timelines or scientific processes, engaging students through visual flow.
Government consultants rely on it for policy impact diagrams, showing how initiatives link across departments. Enterprise teams use it in quarterly reviews to map project interdependencies, ensuring all stakeholders grasp the big picture quickly.
Seamless Integration into Your Presentation Routine
This template fits effortlessly into standard workflows, compatible with PowerPoint 2016 and later, Keynote, and Google Slides. Start by importing your data via simple copy-paste from spreadsheets, then tweak connections and colors using built-in tools - no advanced skills required.
In my experience, it shaves hours off design time, allowing real-time edits during client feedback sessions. Lifetime access means one-time purchase for unlimited use across projects.
Concrete Examples from Client Work
For a tech consultant, I customized this to diagram API integrations in a proposal, connecting service nodes to demonstrate seamless data flow and winning the contract. Managers in manufacturing use it for supply chain overviews, highlighting bottleneck points with color-coded balls.
Educators adapt it for biology lessons, linking organism roles in ecosystems. Founders pitch venture capital by mapping growth strategies, with balls representing milestones connected by timeline arrows.
Analysts in finance employ it for portfolio relationship charts, showing asset correlations visually for clearer risk assessments.
Why This Template Outperforms Alternatives
AspectThis TemplateDefault PowerPointFrom ScratchOther SolutionsDesign TimeMinutes to customizeHours for basic setupDays for polishVariable, often subscription-basedFlexibilityFully editable vectorsLimited shapesUnlimited but tediousTemplate-lockedVisual ImpactProfessional connectionsGeneric linesDepends on skillVaries by providerCostOne-time feeFree but time-costlyFree but labor-intensiveOngoing feesDownload this template to transform your next deck into a compelling visual narrative.
Industry-Specific Adaptations
In finance, it maps investment networks, connecting funds to returns. Tech firms use it for software architecture diagrams, linking modules.
Healthcare professionals diagram patient care pathways, from diagnosis to treatment. Educators build knowledge trees for subjects like history.
Marketers visualize customer journeys, with balls as touchpoints. Consultants create strategy webs for client roadmaps.
Frequently Asked Questions
How do I import data into these connected balls charts?
Simply copy from Excel and paste into placeholders. The template supports direct links for dynamic updates, ensuring your diagrams reflect real-time figures without manual re-entry.
Is this template compatible with Google Slides?
Yes, it works seamlessly in Google Slides, maintaining all editable features and animations for collaborative editing.
Can I animate the connections for step-by-step reveals?
Absolutely, built-in animations let you unveil links progressively, perfect for guiding audiences through complex ideas in meetings or classes.
What if I need to change the color scheme for branding?
Use PowerPoint's color tools to adjust palettes instantly, with pre-sets for quick starts and options for custom hex codes.
How does this help in virtual presentations?
Its clean design and scalable vectors ensure clarity on any screen, while animations keep remote viewers engaged.
Is there support for high-contrast modes?
The template includes accessibility features like tweakable contrasts, making it inclusive for all audiences.
Good for
- Project roadmaps and sprint plans
- Product launch timelines
- Quarterly or annual review decks
- Company history and milestone summaries
Licence
reviews
The horizon graph for compact data.
The bands fold negative values.
Used this for a stock chart.
The color scheme is blue/orange.
FAQ
Will it work in Google Slides?
Are fonts embedded?
Can I use this for client work?
What's the refund policy?
Do you update the template after purchase?
Similar templates
See all PowerPoint Charts →

All 25 slides