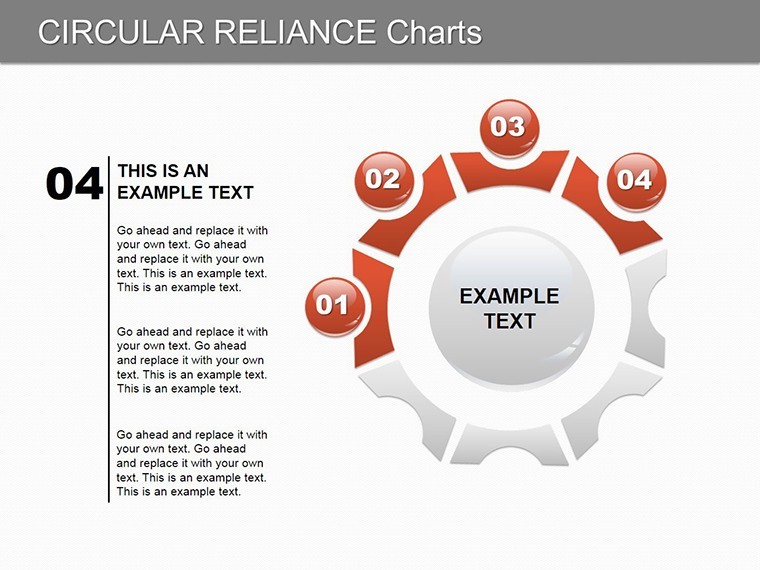
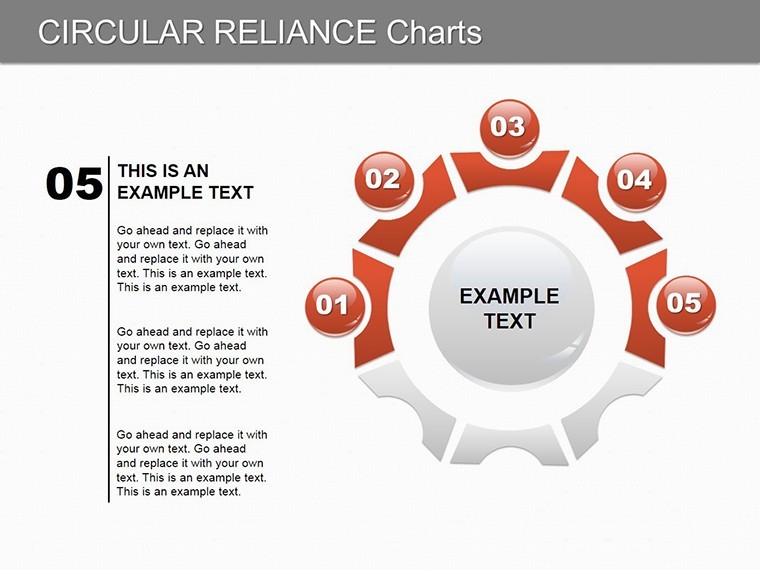
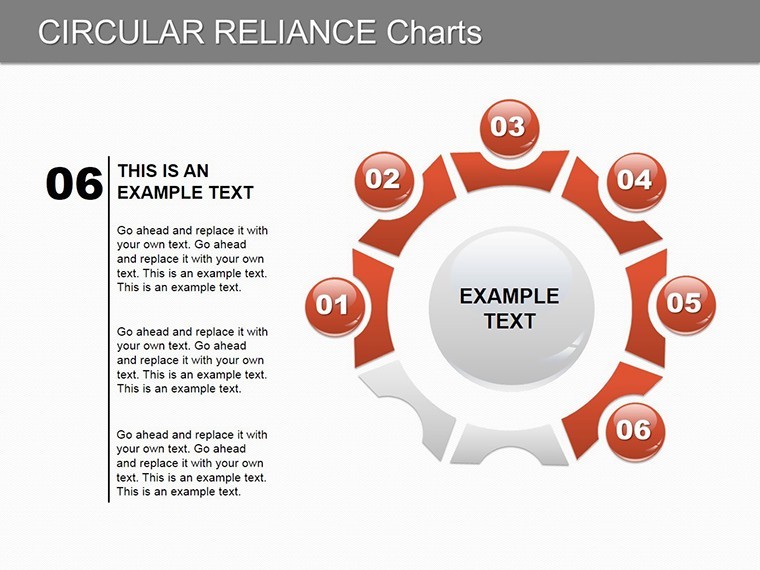
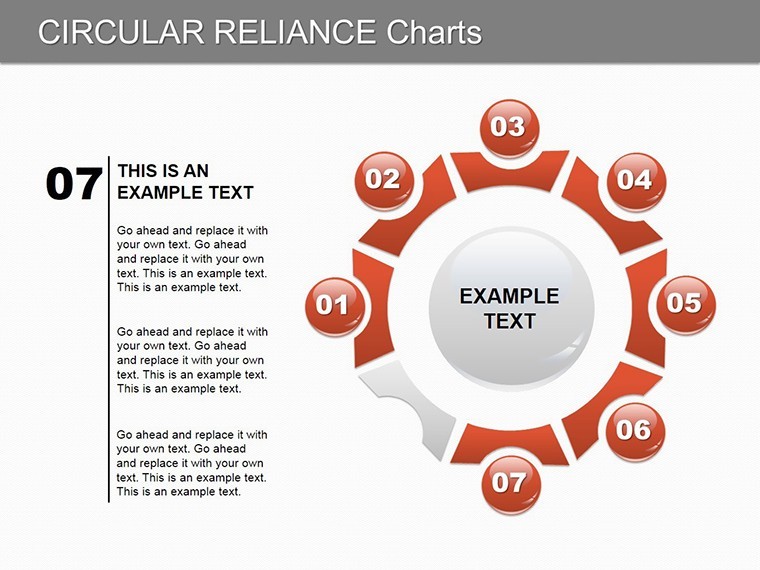
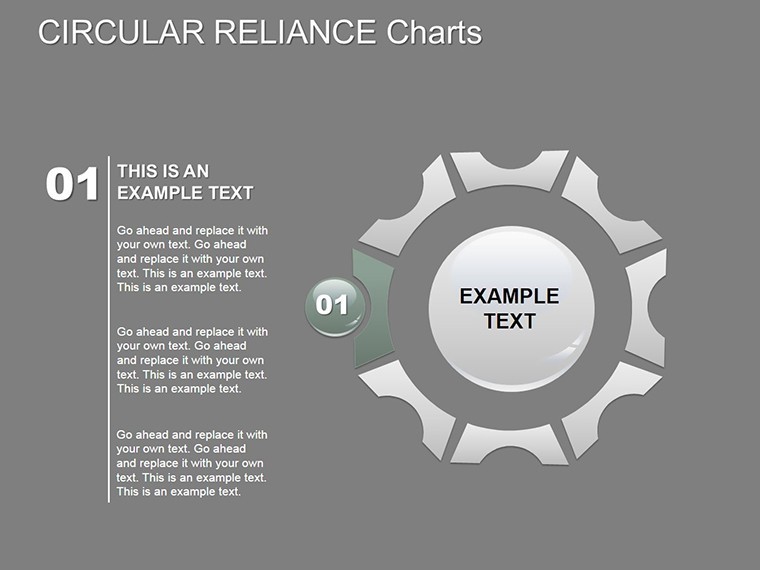
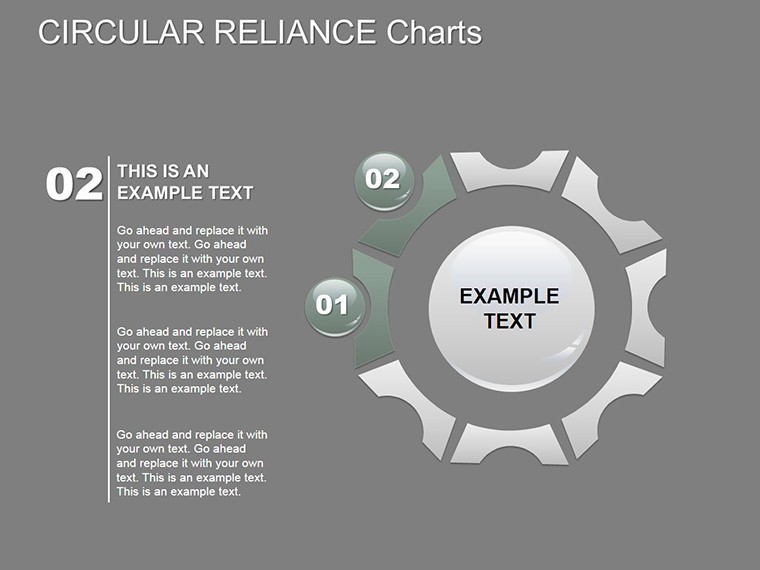
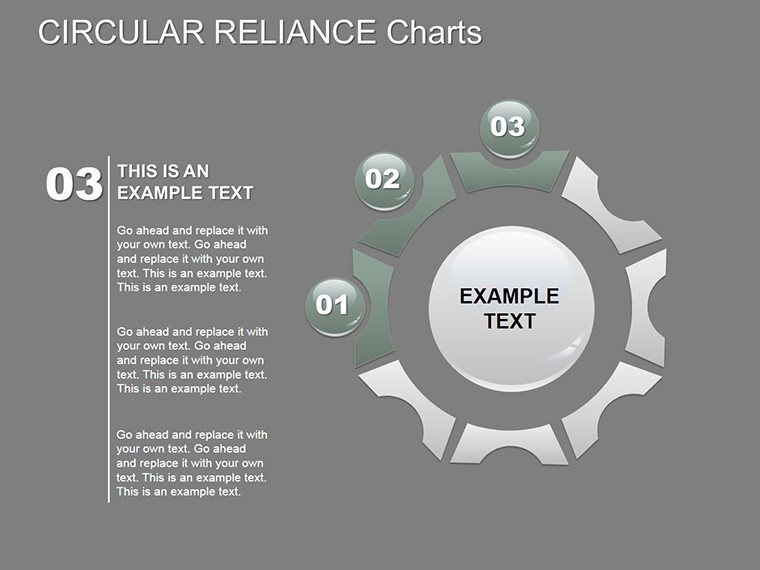
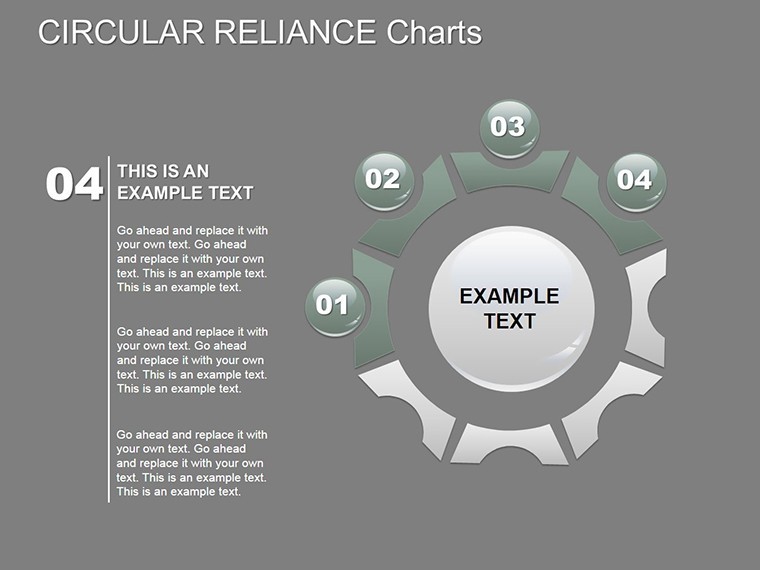
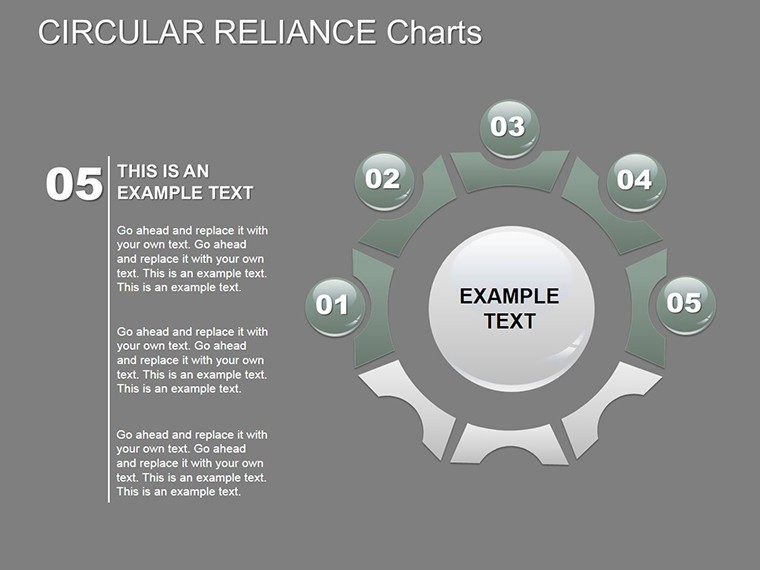
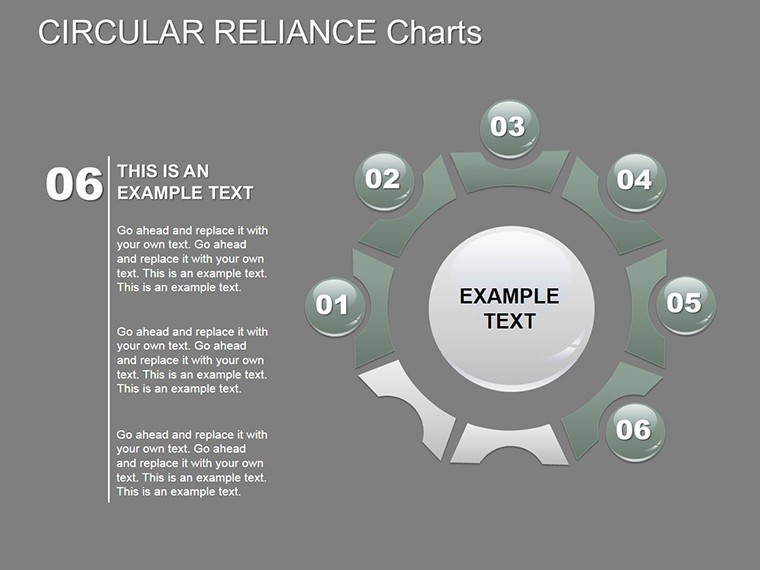
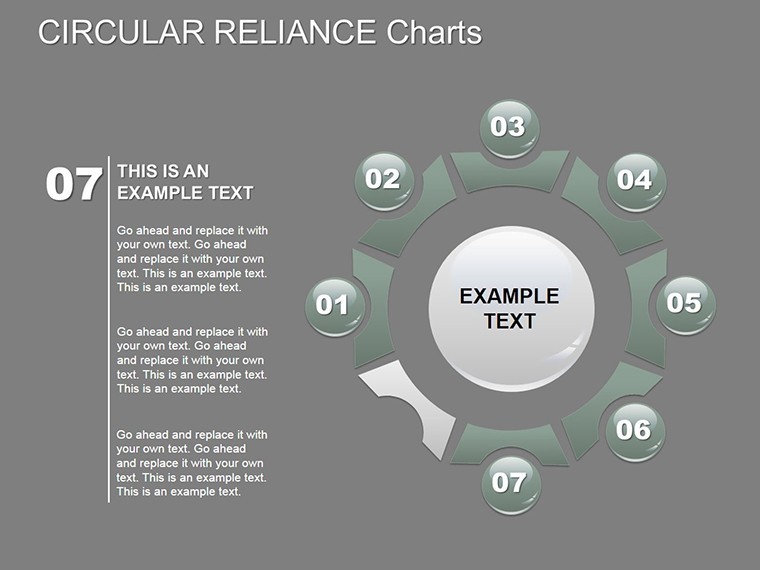
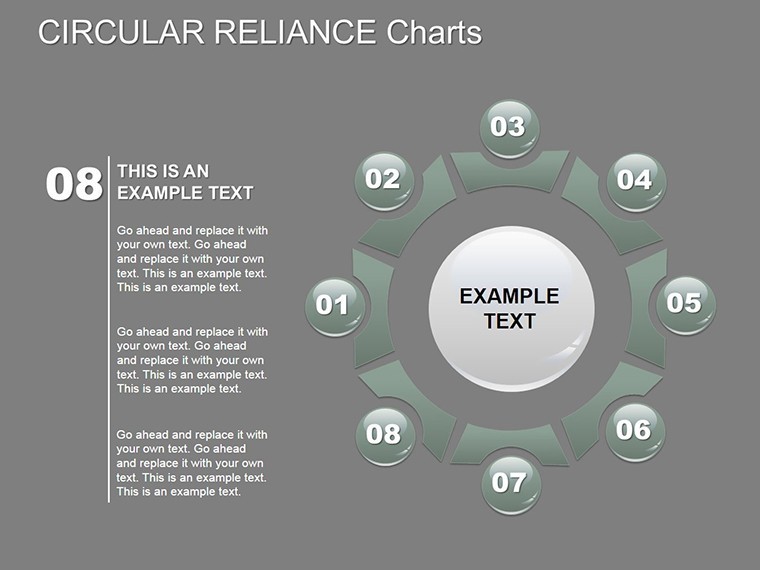
 Click to zoom
Circular Reliance Keynote Charts: Master Data Interdependence Visually
| Format | .pptx |
| Slides | 28 unique layouts |
| Aspect ratio | 16:9 |
| Compatibility | PowerPoint |
| Animated | No |
| Language | English |
| License | Commercial |
| File size | — |
| Version | v1.0 |
| Last updated | September 2023 |
What's inside
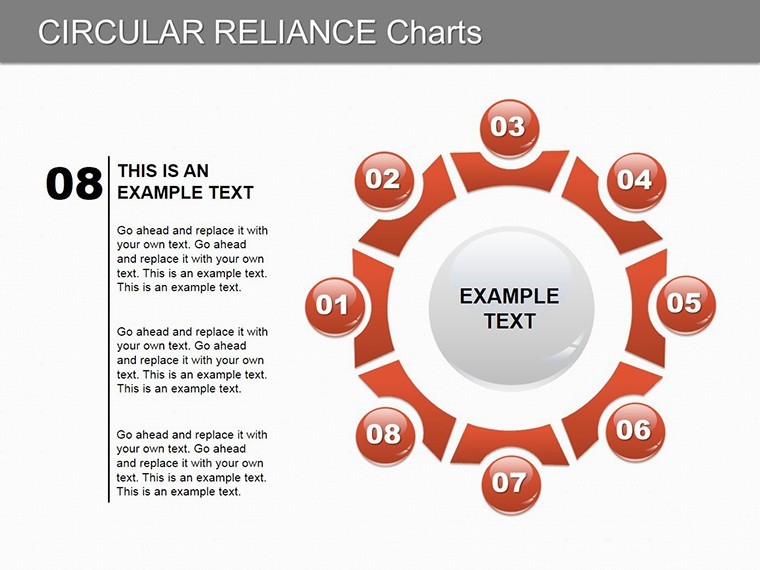
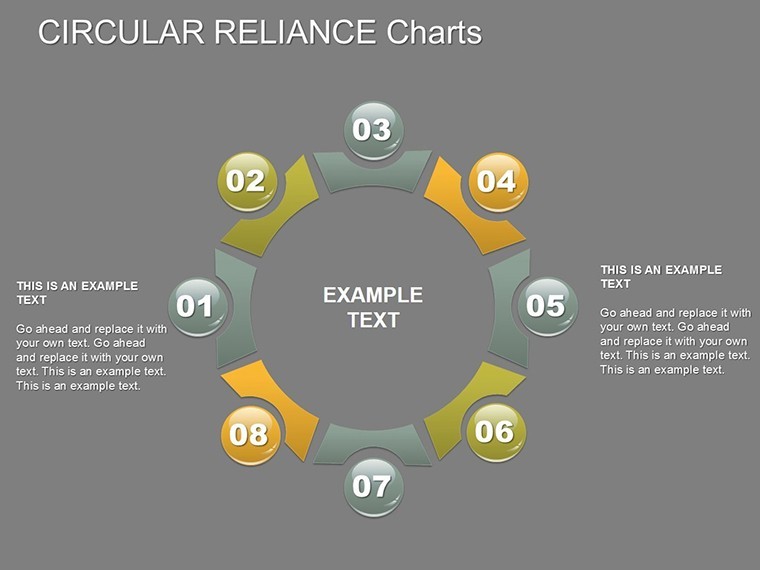
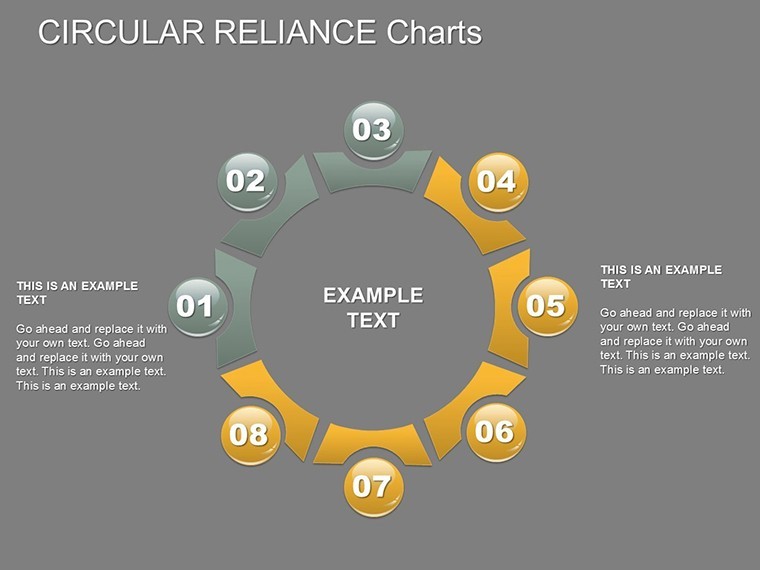
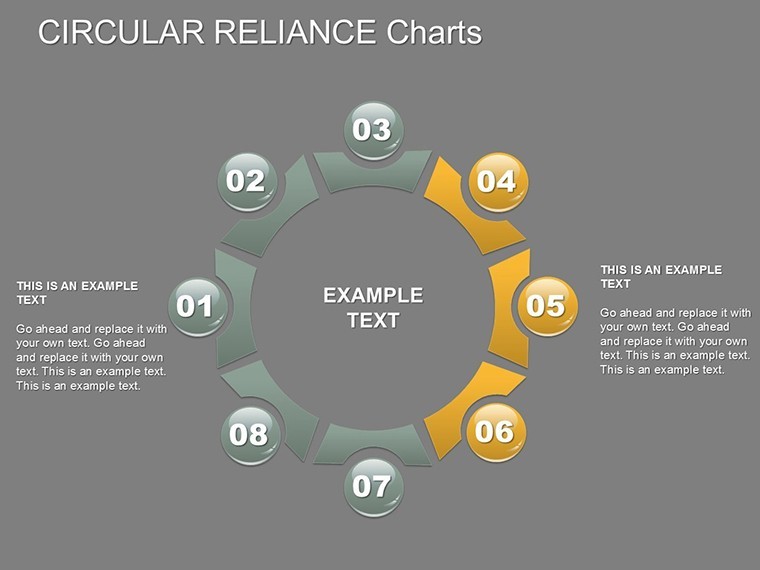
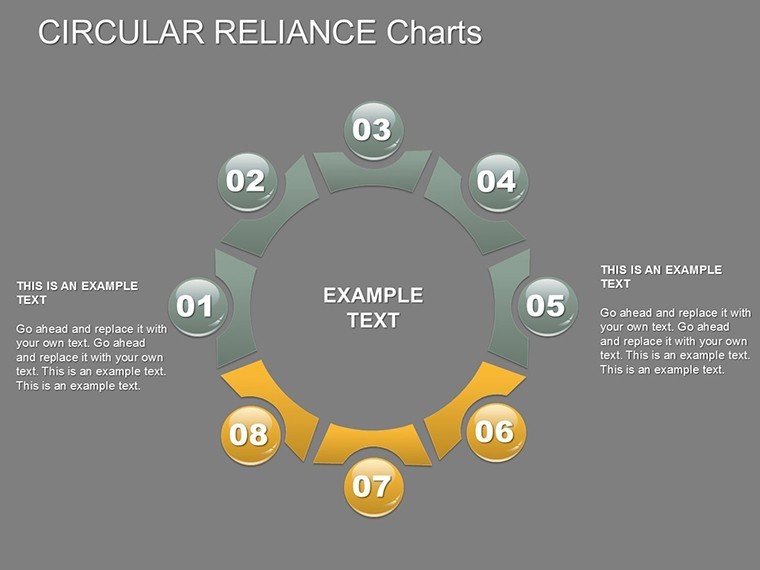
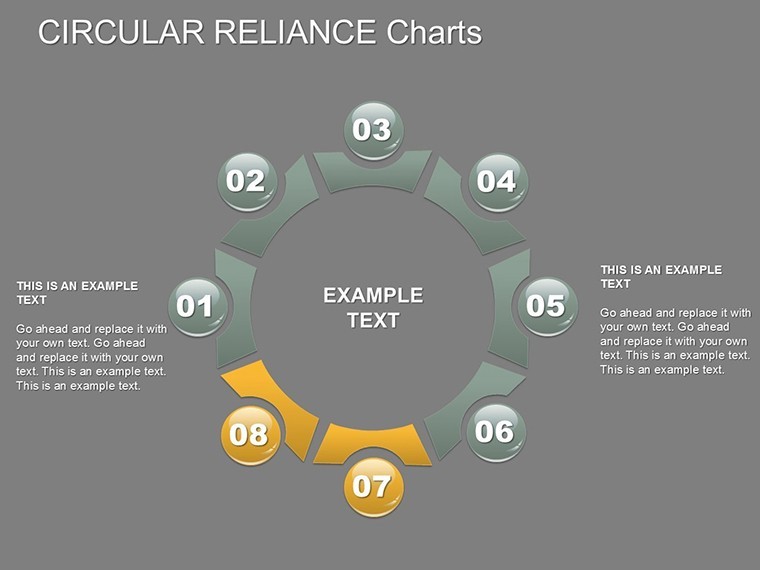
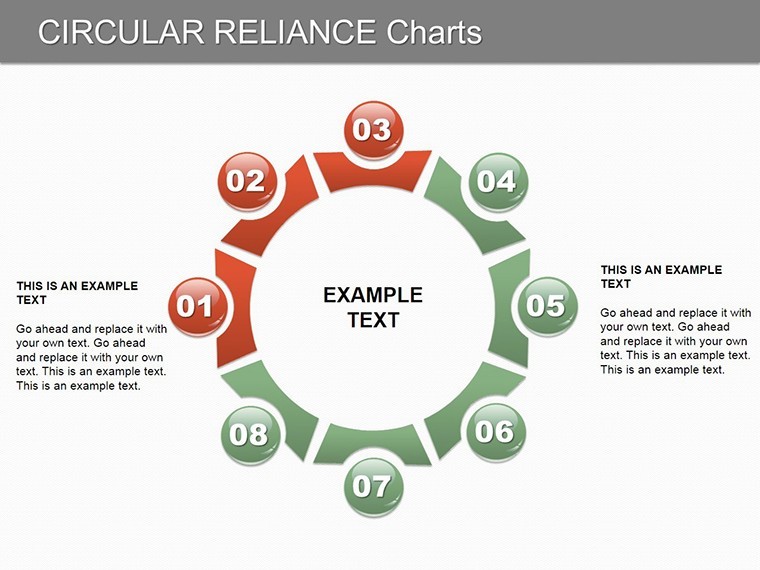
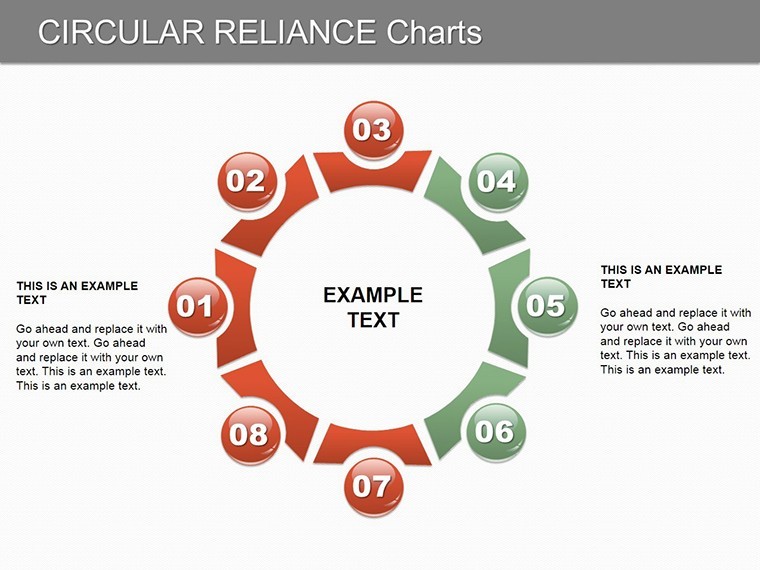
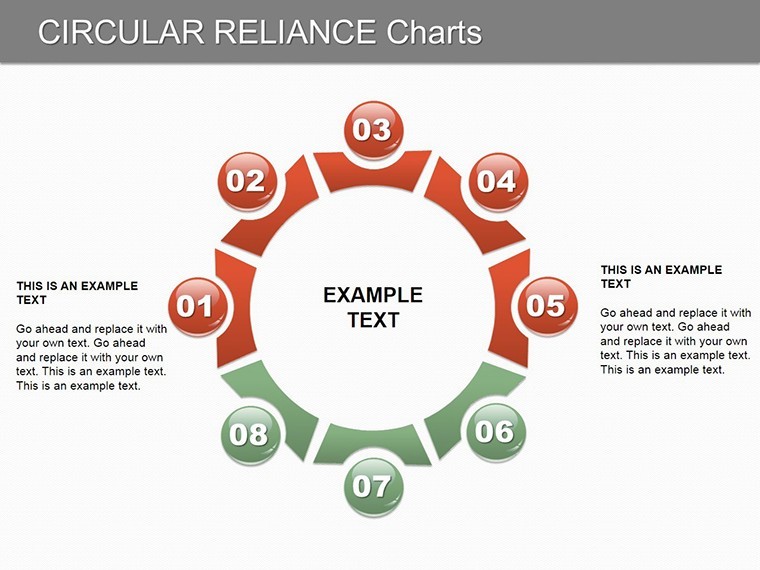
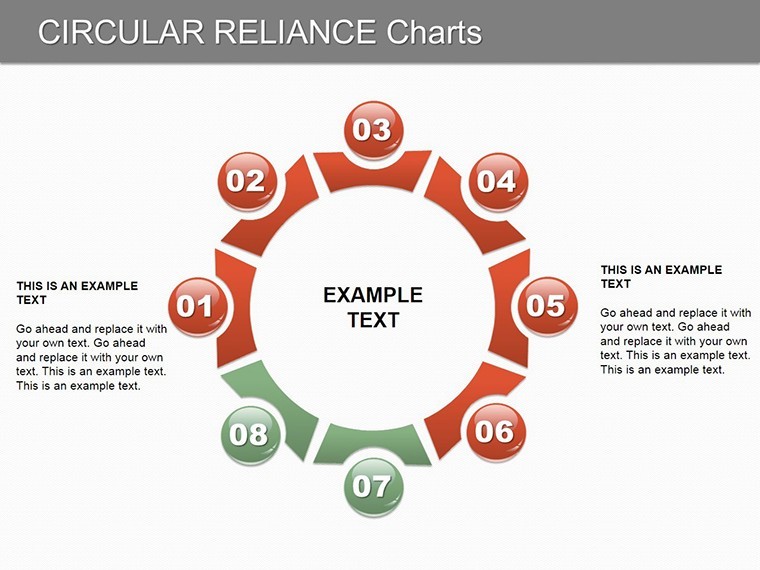
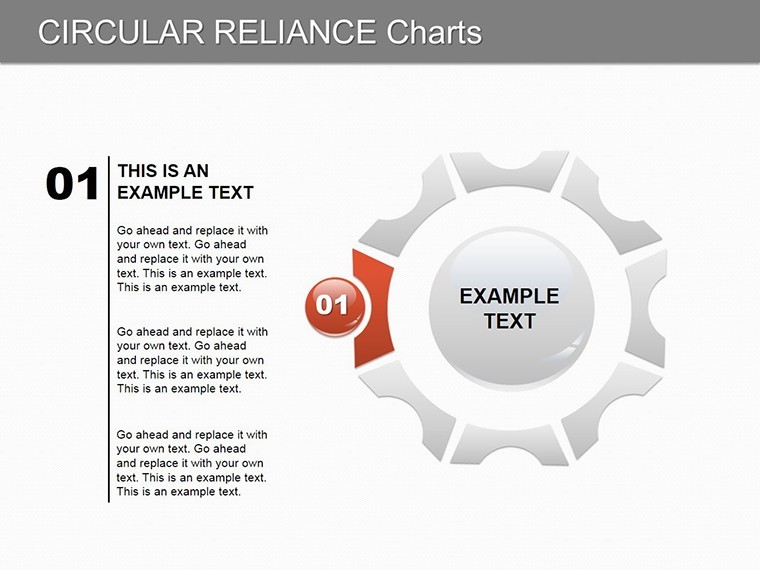
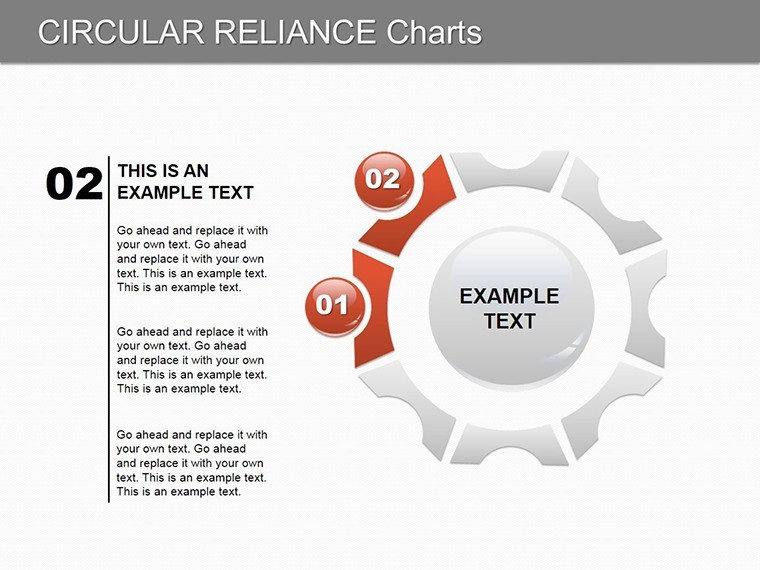
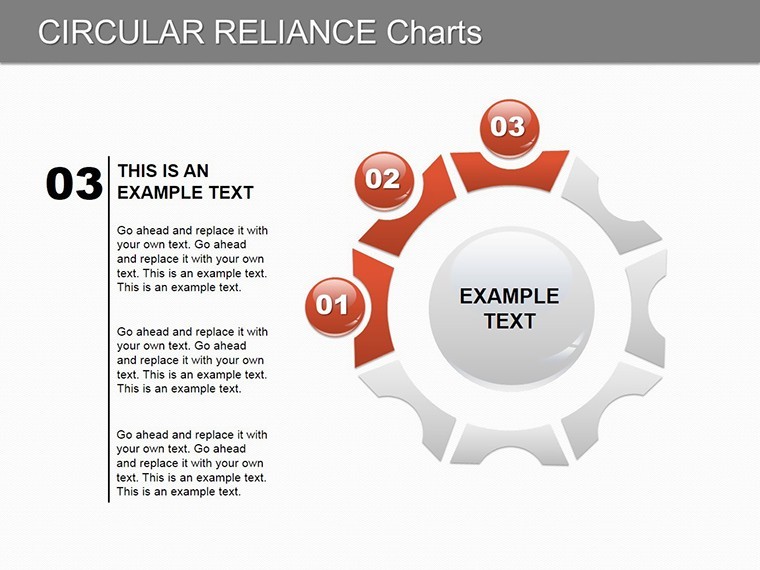
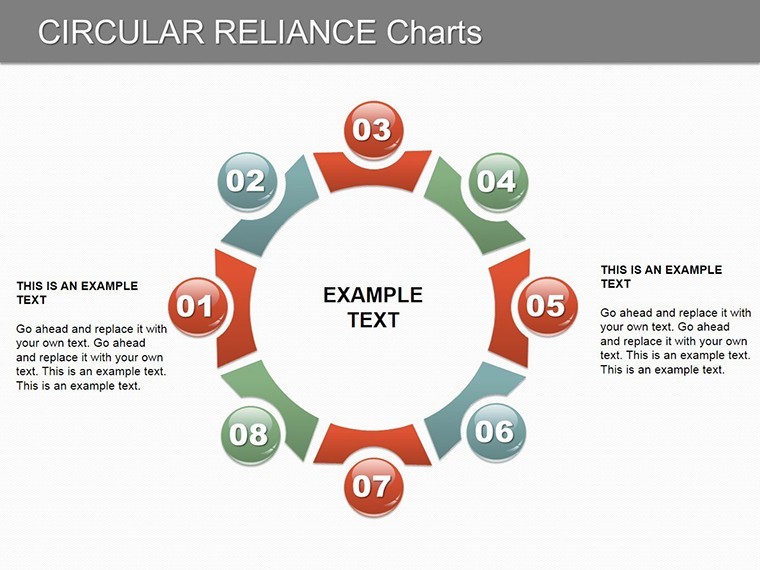
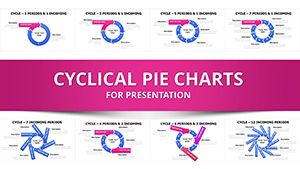
In the interconnected world of modern business, data doesn't stand alone - it relies on relationships, dependencies, and mutual influences. Our Circular Reliance Keynote Charts template captures this essence perfectly, offering 28 editable slides that turn intricate interdependencies into clear, captivating infographics. Tailored for Keynote users but easily convertible to PowerPoint or Google Slides, this tool empowers executives, analysts, and educators to showcase how elements in their projects or strategies lean on one another for success.
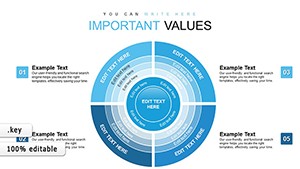
Why settle for disjointed spreadsheets when you can illustrate supply chain reliances or team synergies with elegant circular designs? These charts feature layered spheres and pie-like segments that reveal hidden connections, making your presentations not just informative but insightful. Drawing from real-world applications, like how a tech startup used similar visuals to map API dependencies, resulting in faster investor buy-in, this template bridges the gap between raw data and strategic storytelling.
Standout Features for Professional Polish
Every slide in this collection is a powerhouse of flexibility, from basic reliance wheels to advanced multi-tiered infographics. High-quality vectors ensure scalability, while the modern aesthetic - clean lines and subtle gradients - aligns with contemporary design trends endorsed by platforms like SlideShare.
- Infographic-Rich Layouts: Pre-built visuals for dependency mapping, perfect for risk assessments or partnership overviews.
- Seamless Editing Tools: Change data, colors, and labels intuitively, with smart guides for alignment.
- Industry-Agnostic Versatility: Adapt for finance (portfolio interlinks), healthcare (treatment protocols), or marketing (campaign ecosystems).
- Export-Ready Formats: PNG and SVG options for embedding in documents or websites.
These aren't generic templates; they're informed by data visualization best practices from experts like Edward Tufte, emphasizing clarity over clutter. A consulting firm recently leveraged these for a client merger analysis, cutting explanation time in half while boosting comprehension scores in post-presentation surveys.
Tailoring to Your Narrative
Begin by selecting a reliance hub slide and populating it with core metrics. For a sales forecast, link revenue circles to market factors, using opacity layers to show strength of dependencies. In educational contexts, depict scientific processes where variables interrely, akin to ecosystem models in biology curricula. The template's neutral palette allows brand syncing, and for Google Slides adaptation, use the import feature to maintain infographic integrity.
Practical Use Cases Across Sectors
Envision a scenario in project management: Use circular reliance charts to outline task interdependencies, preventing bottlenecks before they arise - much like PMI standards recommend for agile workflows. In architecture firms, map material sourcing chains, circling sustainability factors to highlight eco-friendly choices in line with LEED certifications.
For marketers, these slides excel at visualizing customer touchpoint reliances, showing how social media feeds into email campaigns for holistic ROI views. One digital agency shared how this approach clarified their funnel strategy, leading to a 25% uplift in engagement metrics during quarterly reviews.
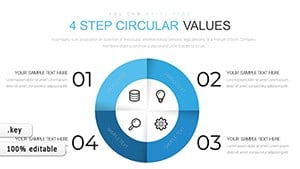
- Step 1: Map Dependencies – Identify and place interconnected elements in circular segments.
- Step 2: Layer Insights – Add data labels and color-code for quick scanning.
- Step 3: Animate Connections – Enable Keynote builds to reveal relationships progressively.
- Step 4: Review and Refine – Collaborate via shared links for feedback.
Versus basic charting tools, this template's focus on reliance adds narrative depth, transforming presentations from informative to influential. It's a time-saver that lets you focus on content over creation.
Pro Tips for Integration
Combine with text overlays for context, and always preview in presentation mode to fine-tune pacing. For PowerPoint users, animations translate well via export, preserving the professional flow that wows audiences.
The Edge You Need in Competitive Presentations
Backed by our expertise in visual communication, this template delivers reliability and innovation. Professionals trust it for its ease and impact - join them and redefine how you present interlinked ideas.
Seize the opportunity to make your data dependencies undeniable. Download Circular Reliance Keynote Charts now and connect the dots in your next big pitch. Unlimited revisions and support included.
Frequently Asked Questions
How do these charts handle complex data sets?
Through layered circular designs that break down interdependencies without overwhelming the viewer.
Is compatibility limited to Keynote?
No, easily adapt to PowerPoint and Google Slides for cross-platform use.
What industries benefit most?
Business, education, and consulting, especially for strategy and analysis visuals.
Can I add my own icons?
Yes, the editable vector format supports seamless icon integration.
Are there animation presets?
Absolutely, built-in Keynote animations enhance the reliance flows dynamically.
How long does customization take?
Typically 10-15 minutes per slide for full personalization.
Good for
- Project roadmaps and sprint plans
- Product launch timelines
- Quarterly or annual review decks
- Company history and milestone summaries
Licence
reviews
Had to make a presentation in one evening and this saved me.
The arrows and circles worked well for explaining workflow steps.
Not the fanciest template ever but it looked fine in meetings.
I mostly changed text and colors and was done quickly.
Used it for a business update and everything stayed neat.
FAQ
Will it work in Google Slides?
Are fonts embedded?
Can I use this for client work?
What's the refund policy?
Do you update the template after purchase?
Similar templates
See all Keynote Charts →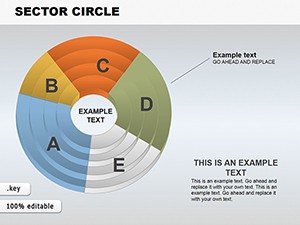
All 28 slides