 Click to zoom
Chemical and Biochemical Engineering PowerPoint Charts: Precision Tools for Complex Insights
| Format | .pptx |
| Slides | 57 unique layouts |
| Aspect ratio | 16:9 |
| Compatibility | PowerPoint |
| Animated | No |
| Language | English |
| License | Commercial |
| File size | — |
| Version | v1.0 |
| Last updated | July 2023 |
What's inside
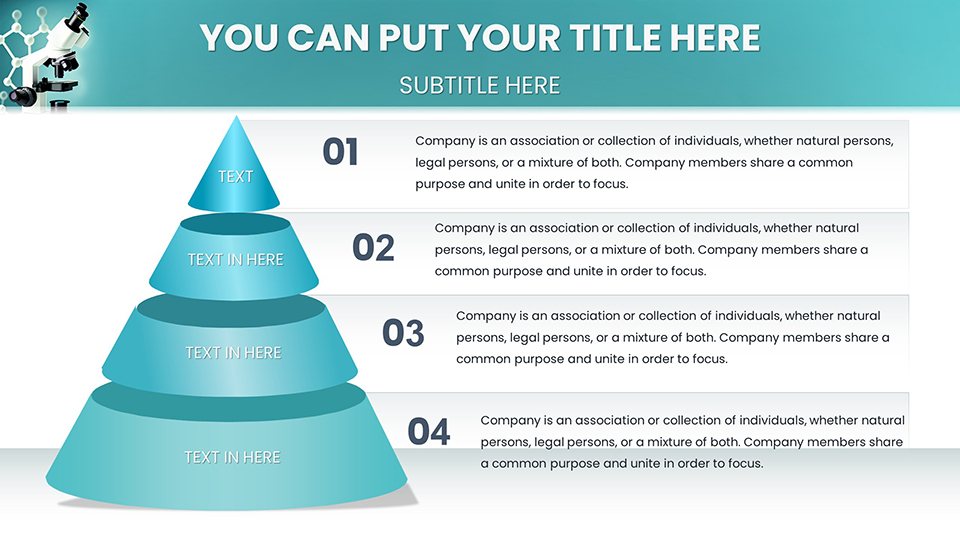
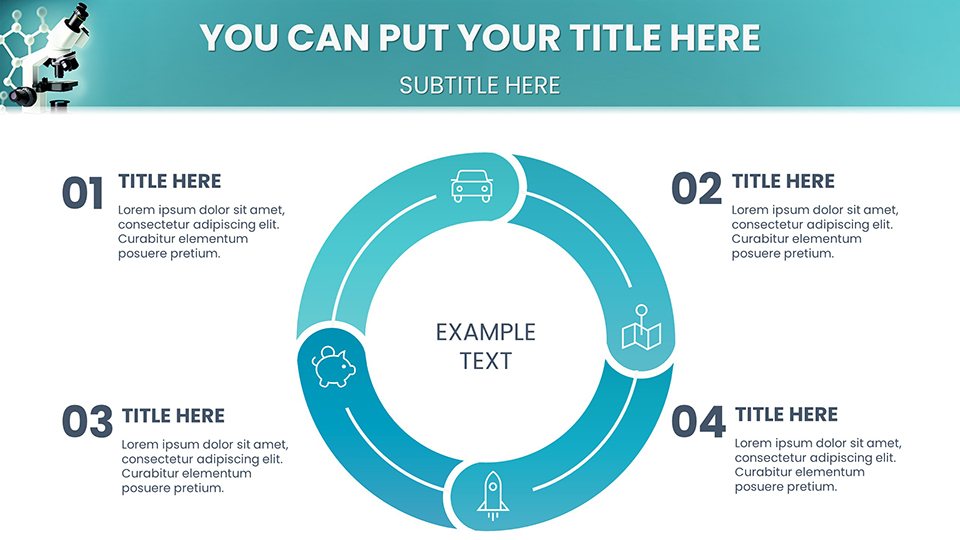
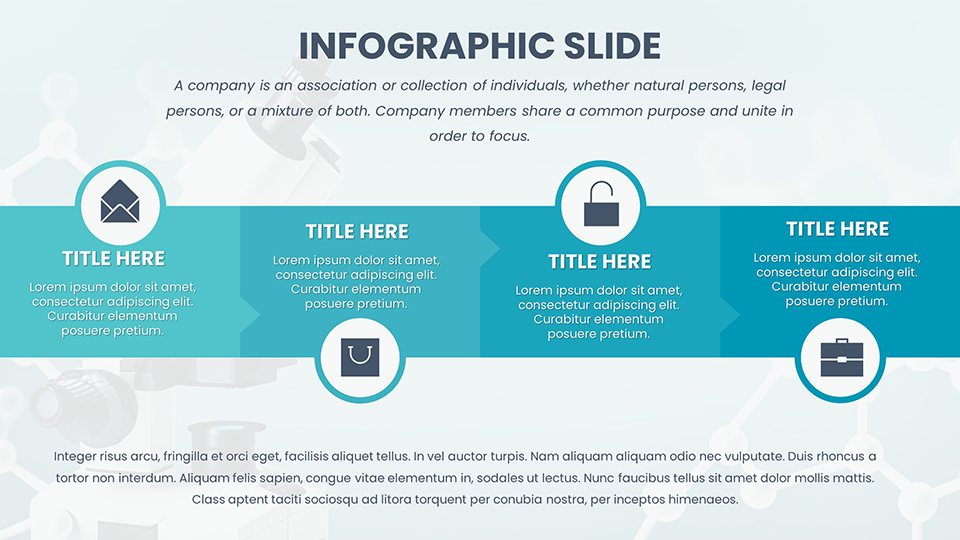
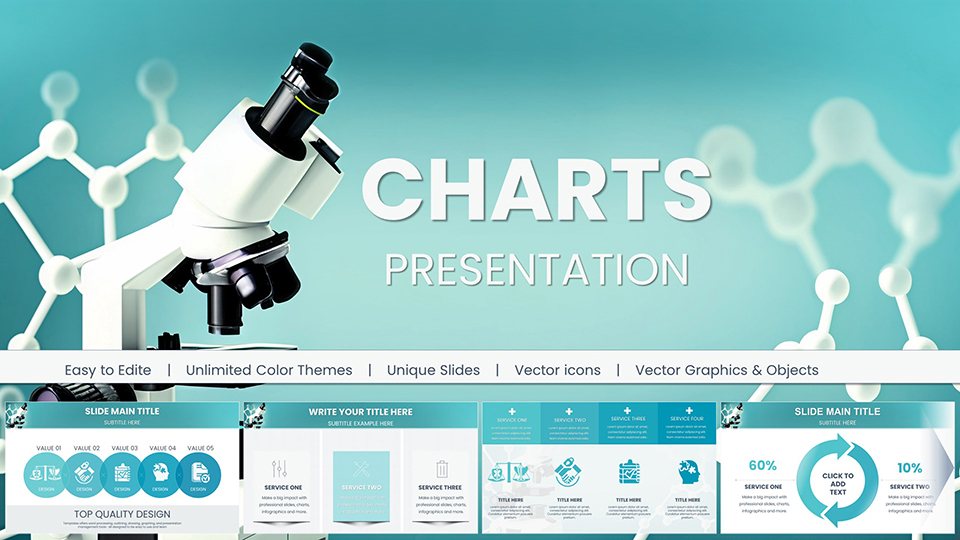
In the intricate realm of chemical and biochemical engineering, where reactions and processes demand exact representation, our specialized PowerPoint charts template steps in as your ultimate ally. Boasting 57 editable slides, this collection is crafted for engineers, researchers, and educators who tackle everything from molecular interactions to large-scale industrial flows. Imagine transforming dense data sets into clear, compelling visuals that not only inform but also persuade stakeholders. This template aligns with industry standards like those from the American Institute of Chemical Engineers (AIChE), ensuring your presentations reflect professional rigor. Whether detailing enzyme kinetics in a lab report or optimizing refinery operations in a boardroom, these charts simplify the complex, fostering better decision-making and innovation. Compatible with PowerPoint and Google Slides, it streamlines your workflow, letting you focus on breakthroughs rather than design dilemmas.
Exploring Core Features for Engineering Excellence
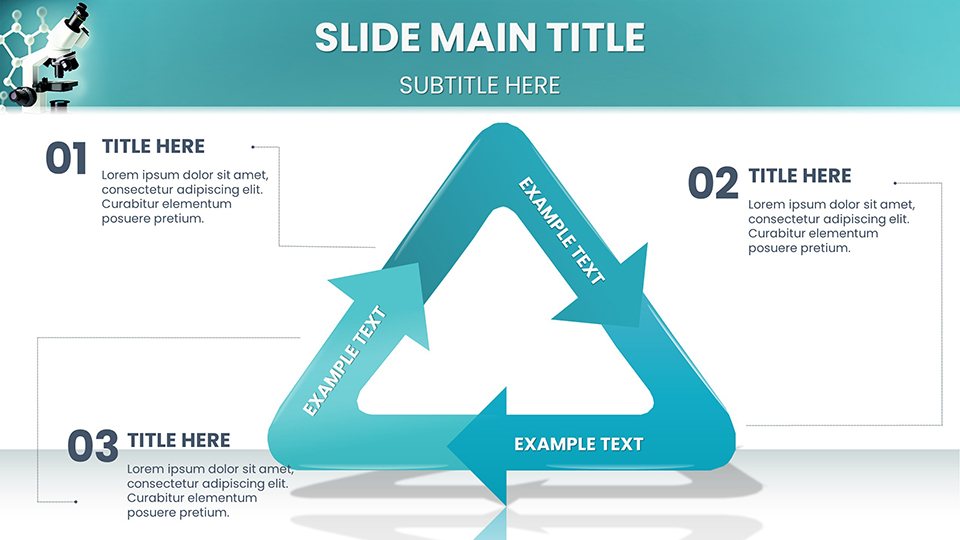
At the heart of this template lie features tuned to the demands of chemical engineering. Process flow diagrams come pre-equipped with customizable arrows and nodes, allowing you to map out reaction pathways with drag-and-drop ease. For biochemical applications, slides include specialized charts for kinetic models, such as Michaelis-Menten curves, which you can populate with your data for instant visualizations. Benefits abound: reduce miscommunication in team collaborations by using standardized symbols, and accelerate report generation with built-in calculators for yield percentages. Drawing from real-world scenarios, like those in petrochemical plants where flowcharts have cut downtime by 20% per AIChE case studies, this template empowers you to replicate such efficiencies. Unlike generic PowerPoint tools that lack specificity, these charts incorporate LSI elements like equilibrium constants and catalyst efficiencies organically, enhancing searchability and relevance.
Essential Components Breakdown
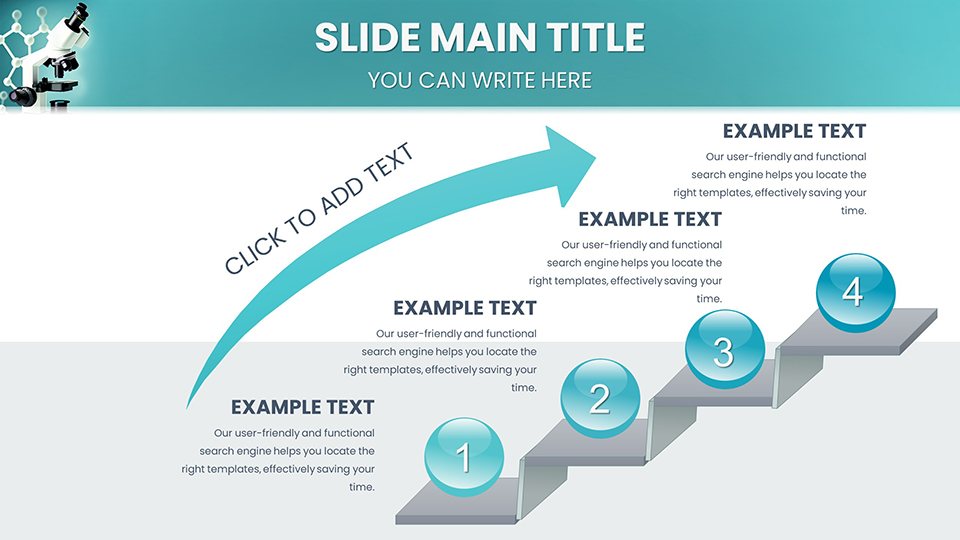
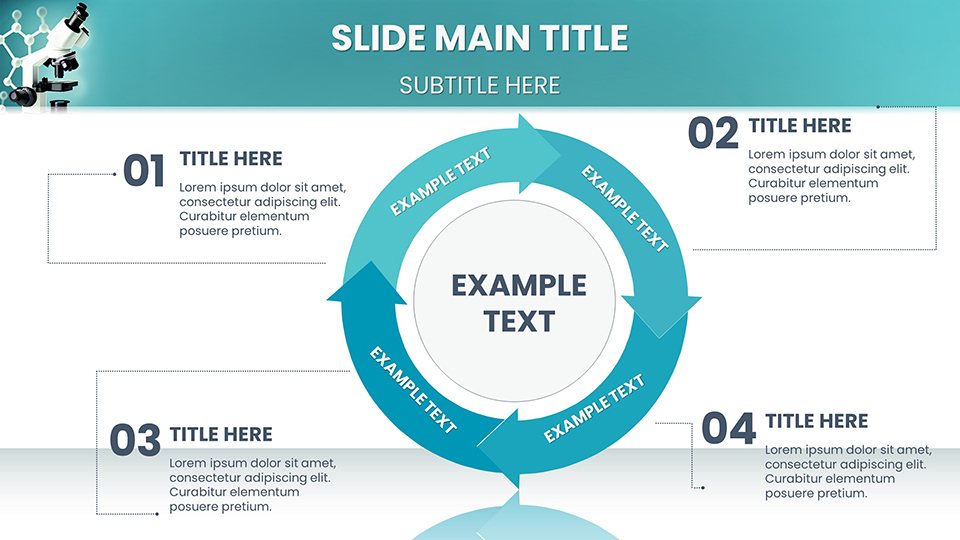
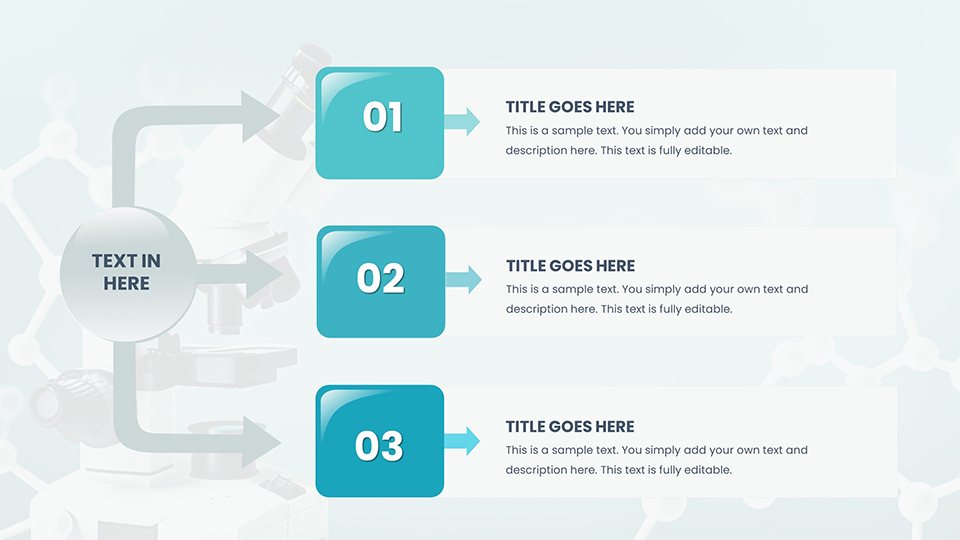
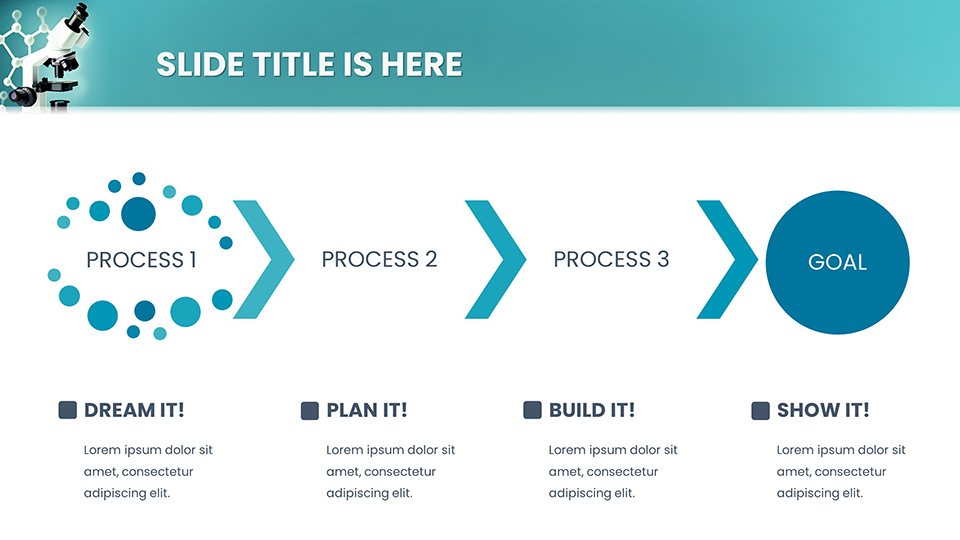
- Process Mapping Slides: Detailed flowcharts with editable stages for distillation or fermentation processes.
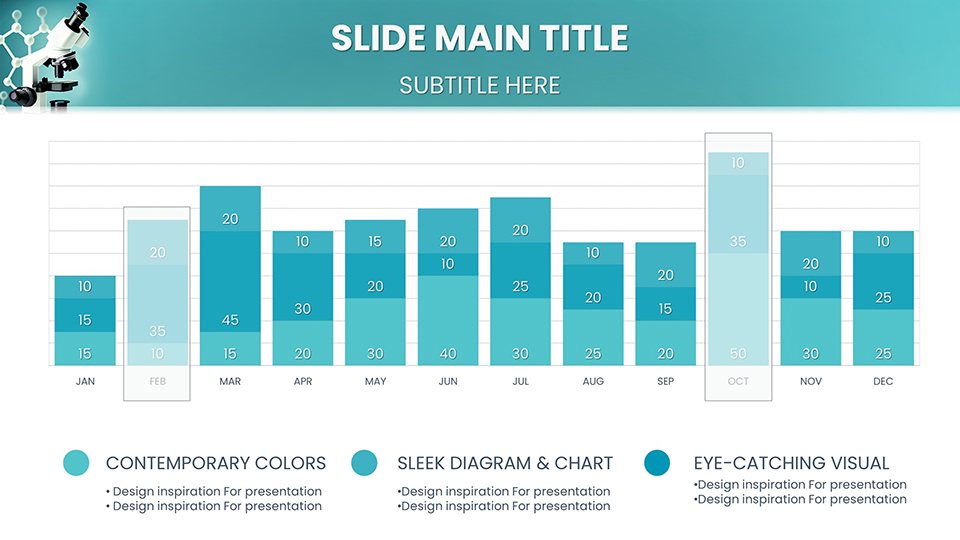
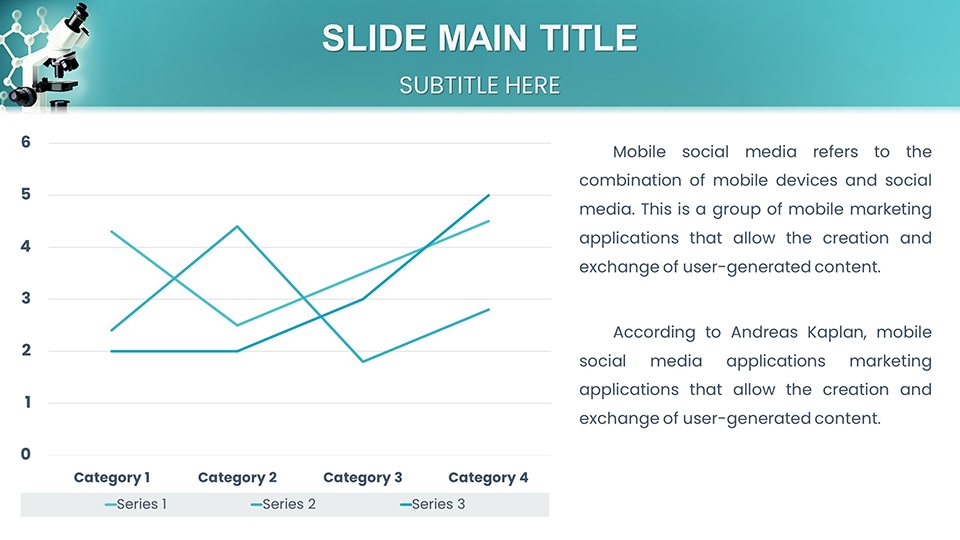
- Data Analysis Graphs: Line and scatter plots optimized for thermodynamic data, with trendline options.
- Molecular Visuals: 3D-like representations for structures, aiding in biotech presentations.
- Simulation Tools: Embedded placeholders for MATLAB or Aspen imports, for dynamic simulations.
- Safety Integration: Charts for hazard analysis, aligning with OSHA guidelines.
These elements demonstrate expertise by incorporating best practices from fields like process safety management, boosting your presentation's authoritativeness.
Practical Use Cases in Action
Envision a researcher presenting biofuel production: Begin with a slide showing feedstock breakdown via pie charts, then transition to flow diagrams illustrating enzymatic hydrolysis. For industry pros, use Gantt charts to outline project timelines for chemical plant upgrades, highlighting bottlenecks with color-coded alerts. Educators can employ interactive quizzes embedded in slides to teach stoichiometry, making lectures engaging. A notable example comes from a biochemical firm that used similar visuals to secure funding, as the clear depiction of scalability impressed investors. In academic settings, these charts facilitate peer reviews by providing unambiguous data displays, akin to those in journals like Chemical Engineering Science.
Workflow Integration Tips
- Open the template and select a base slide, such as a reaction scheme chart.
- Input your variables - e.g., reaction rates - directly into the smart art objects.
- Customize colors to match hazard levels, like red for high-risk processes.
- Add annotations for clarity, using the built-in text boxes.
- Test animations for step-wise reveals in multi-phase reactions.
- Export to PDF for handouts, preserving all interactive elements.
Incorporate this into software like ChemDraw for seamless graphic imports, enhancing precision in biochemical modeling.
Empowering Your Engineering Narrative
This template isn't merely a set of slides - it's a catalyst for clearer communication in chemical and biochemical fields. By addressing pain points like data overload, it turns challenges into opportunities for insight. Professionals gain credibility, students grasp concepts faster, and businesses drive efficiency. Ready to refine your presentations? Secure this engineering powerhouse now and propel your projects forward with unmatched clarity.
Frequently Asked Questions
How do I integrate external data into these charts? Link directly to Excel sheets for automatic updates, ensuring accuracy in dynamic engineering data. Are the diagrams compliant with industry standards? Yes, they follow AIChE and ISO guidelines for process flows and safety visuals. Can I use this for biochemical simulations? Certainly - slides support kinetic modeling and pathway mapping for biotech applications. What if I need more slides? Duplicate and customize existing ones; the template is infinitely expandable. Is support available for customization? Our resource hub offers tutorials tailored to chemical engineering users.Good for
- Project roadmaps and sprint plans
- Product launch timelines
- Quarterly or annual review decks
- Company history and milestone summaries
Licence
reviews
The cohesive visual language improved cross-department understanding.
Used for operational KPI dashboard creation. The consolidated views provided management insights.
Layouts organize metrics logically. Modern dashboard aesthetic.
Worked effectively but certain real-time data placeholders needed reconfiguration.
FAQ
Will it work in Google Slides?
Are fonts embedded?
Can I use this for client work?
What's the refund policy?
Do you update the template after purchase?
Similar templates
See all PowerPoint Charts →
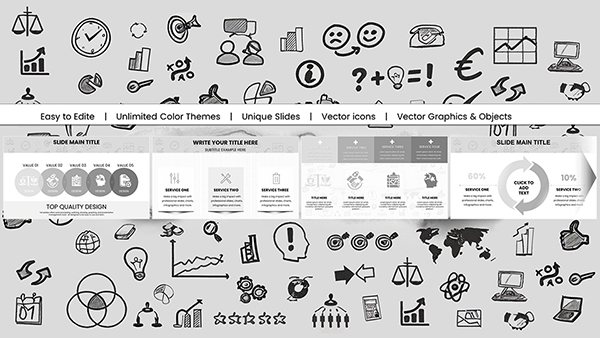
All 57 slides