 Click to zoom
Cause and Effect Tree PowerPoint Charts: Root Out Insights
| Format | .pptx |
| Slides | 38 unique layouts |
| Aspect ratio | 16:9 |
| Compatibility | PowerPoint |
| Animated | No |
| Language | English |
| License | Commercial |
| File size | — |
| Version | v1.0 |
| Last updated | September 2023 |
What's inside
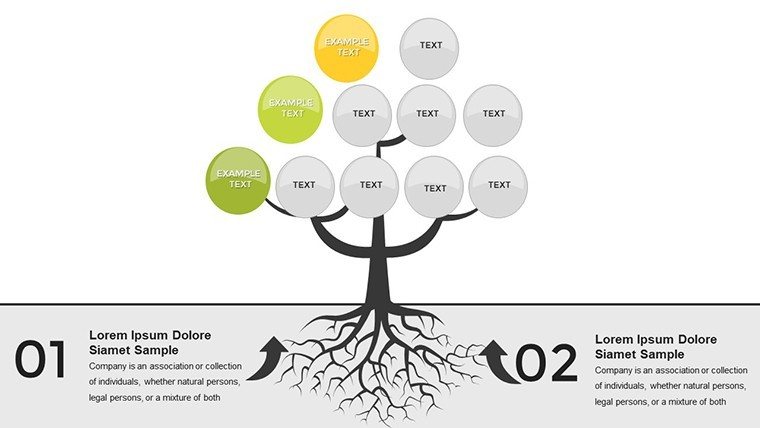
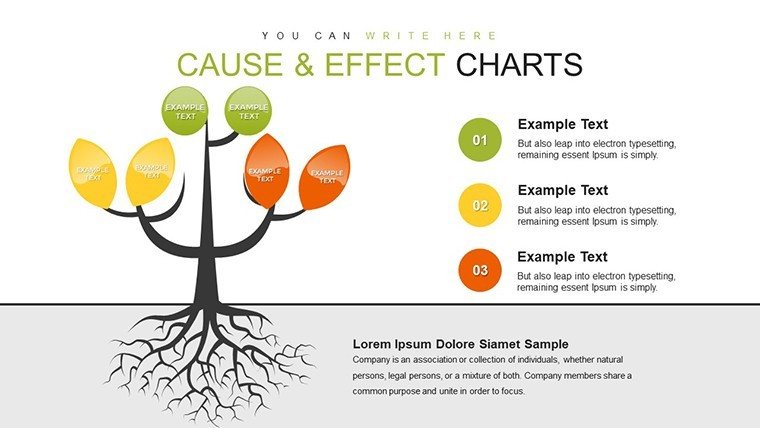
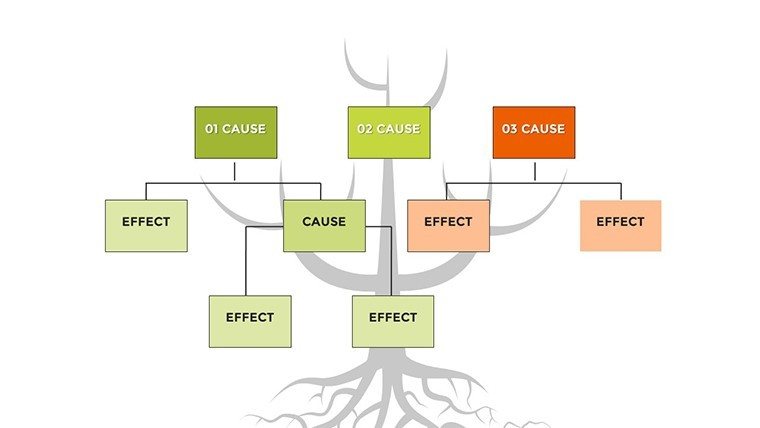
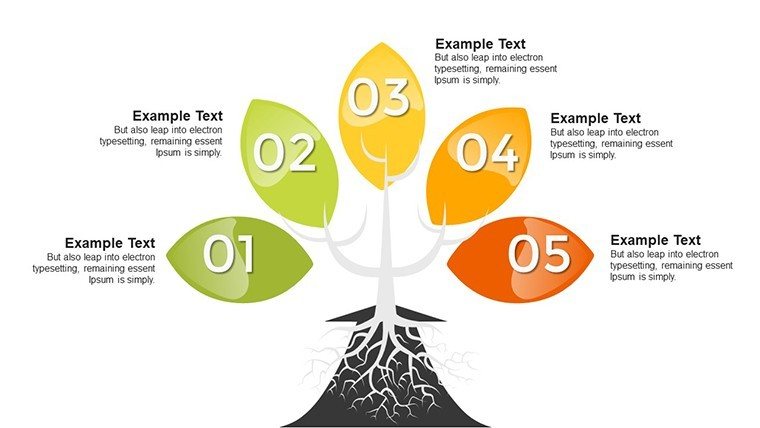
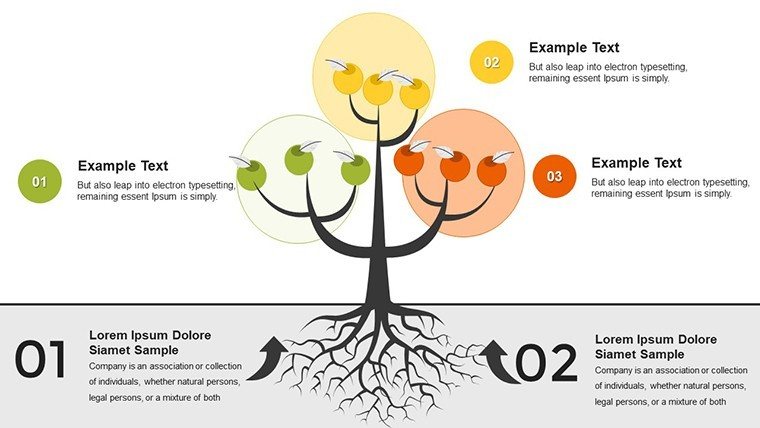
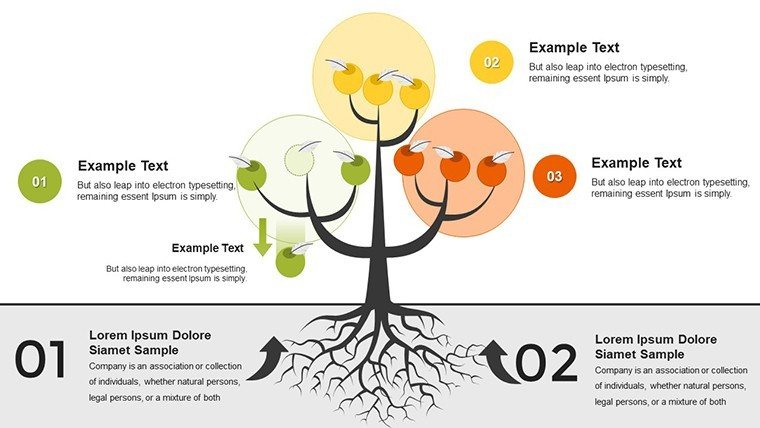
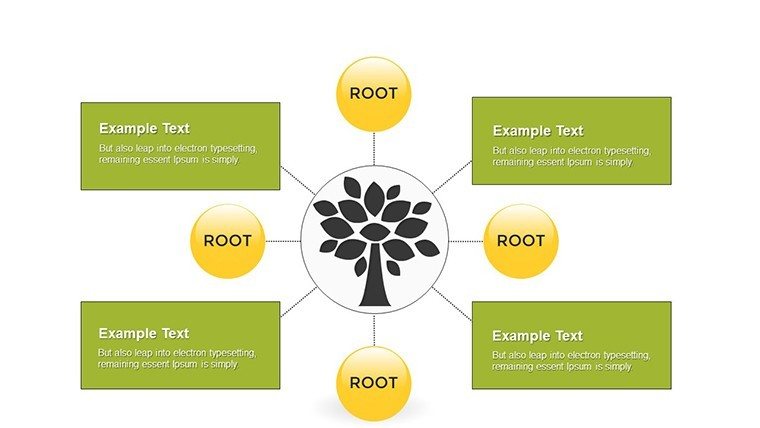
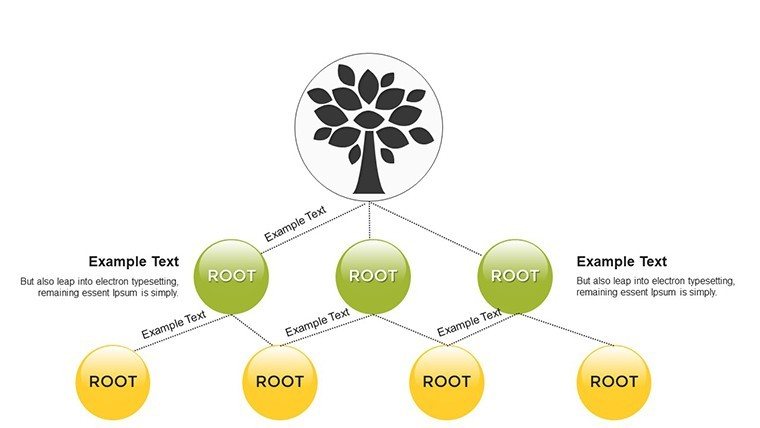
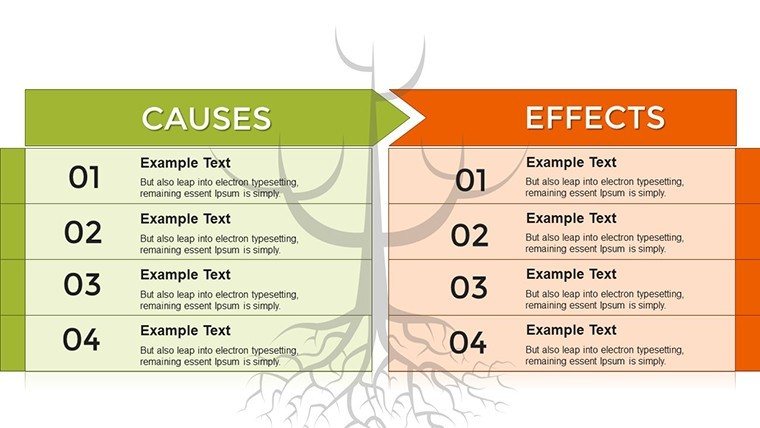
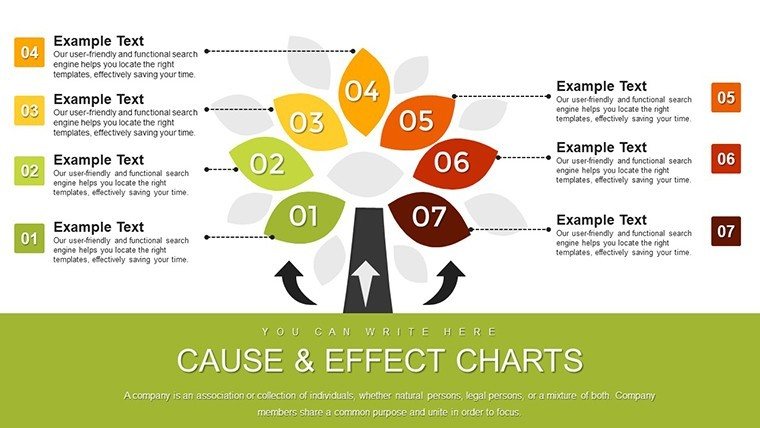
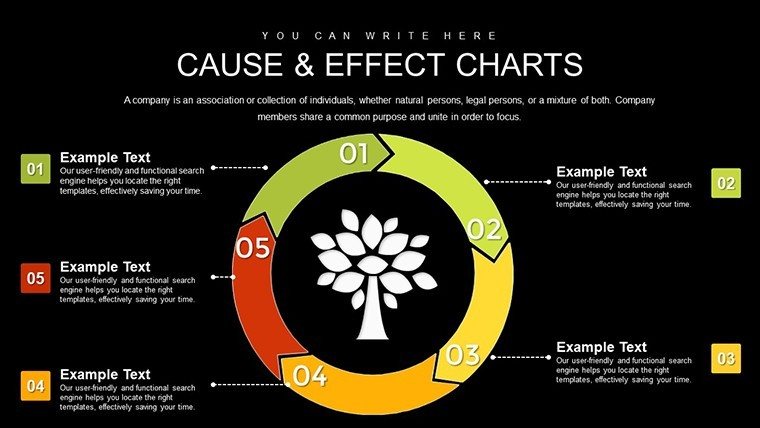
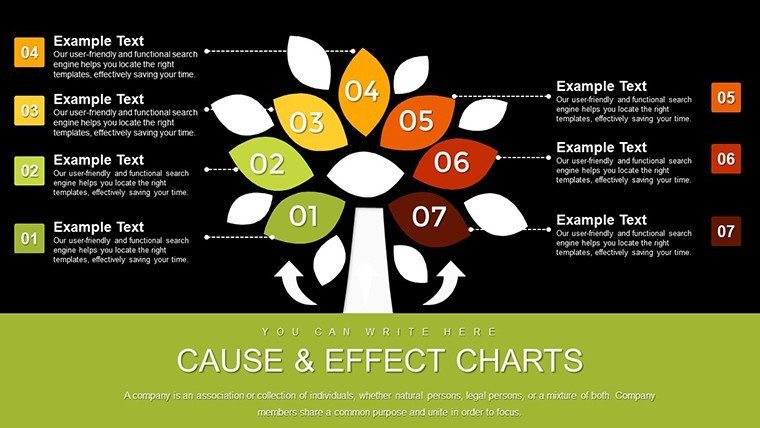
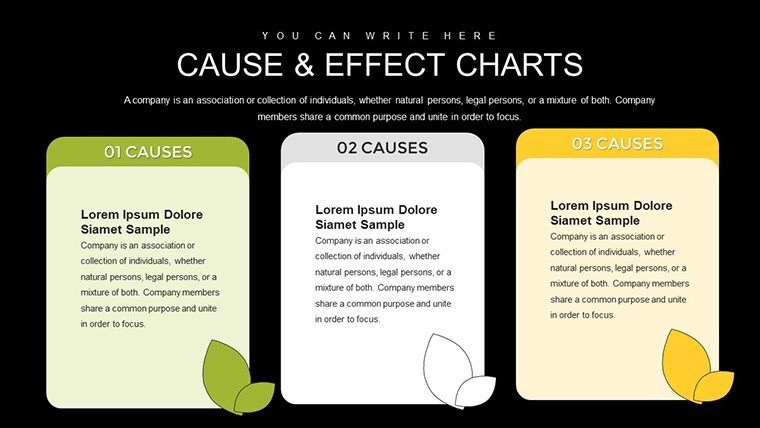
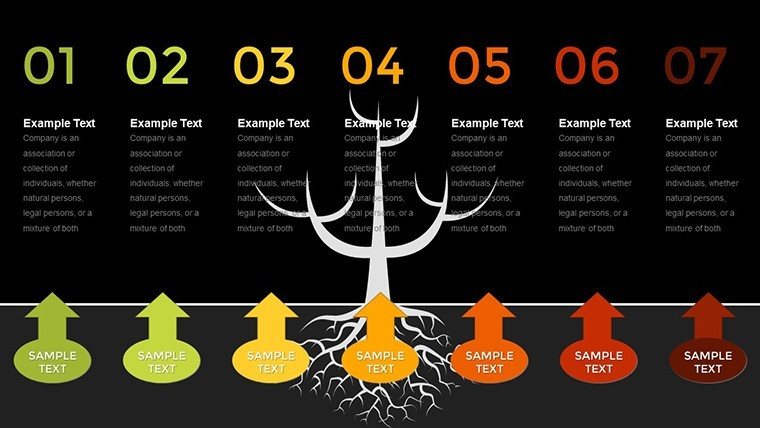
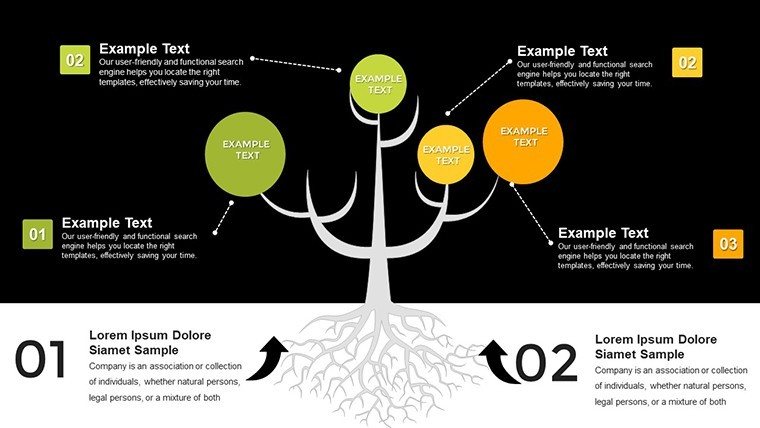
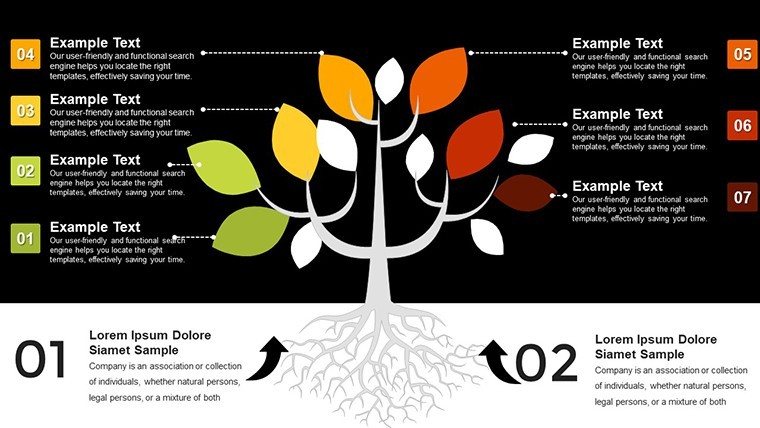
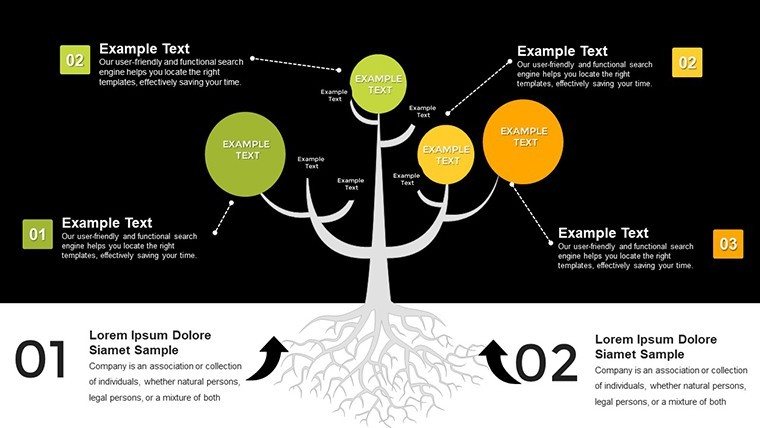
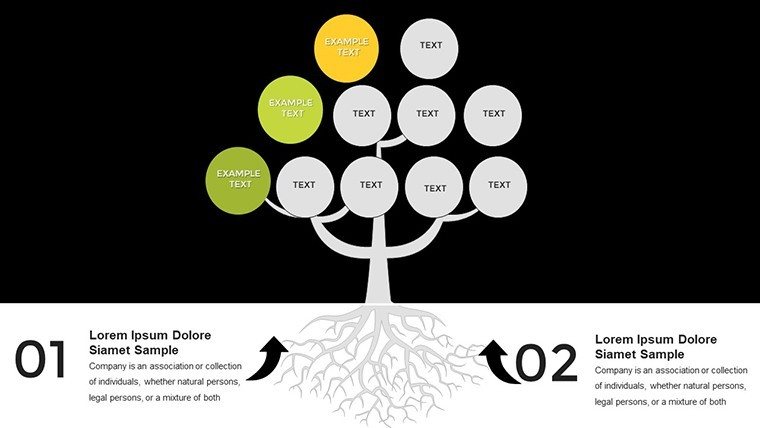
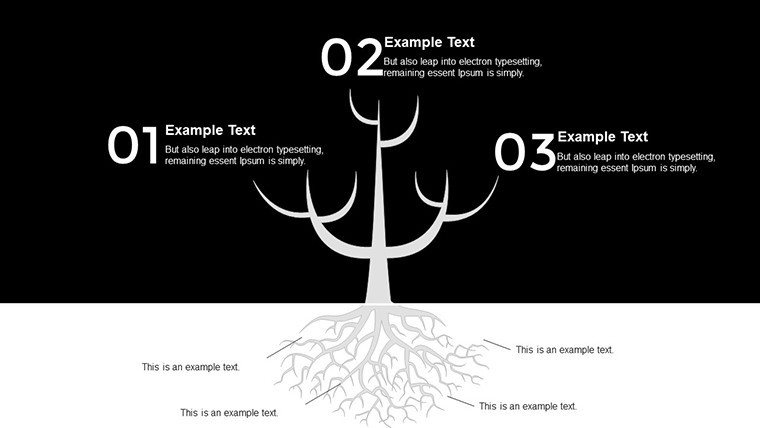
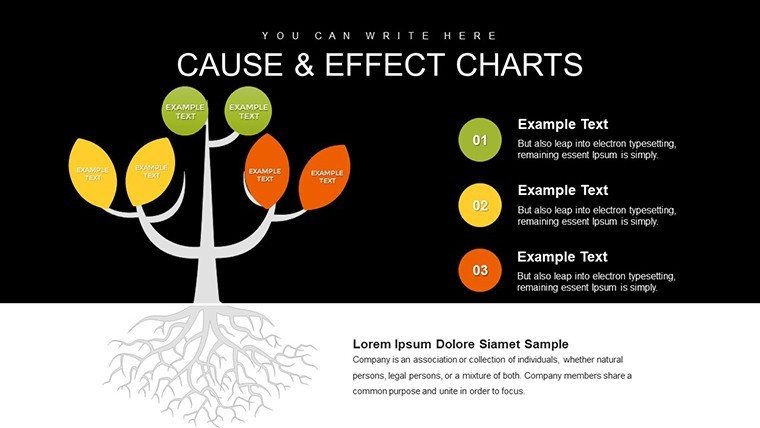
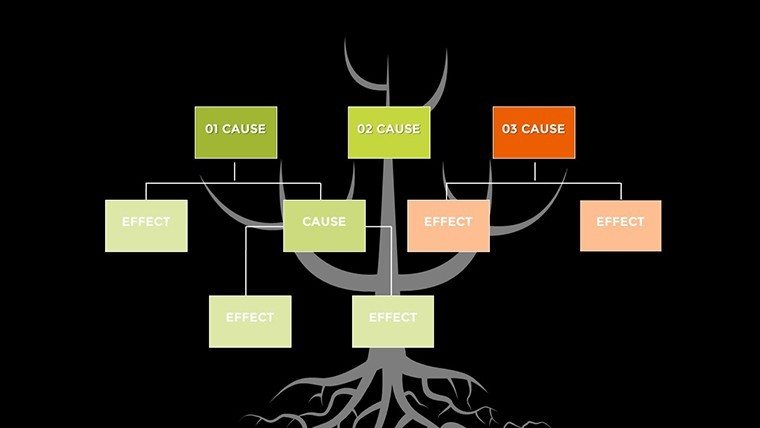
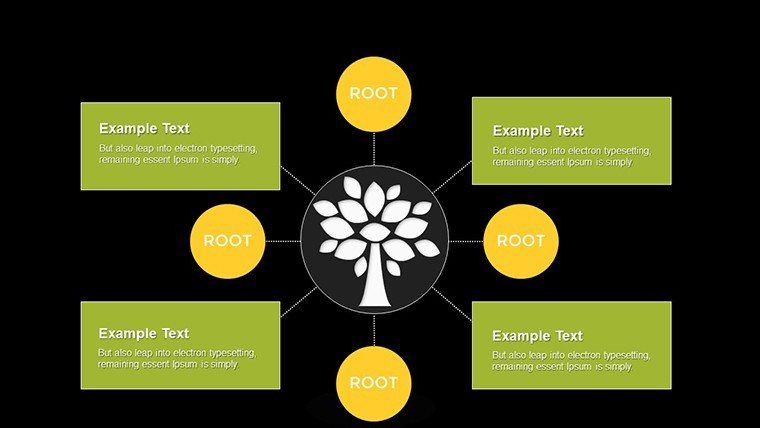
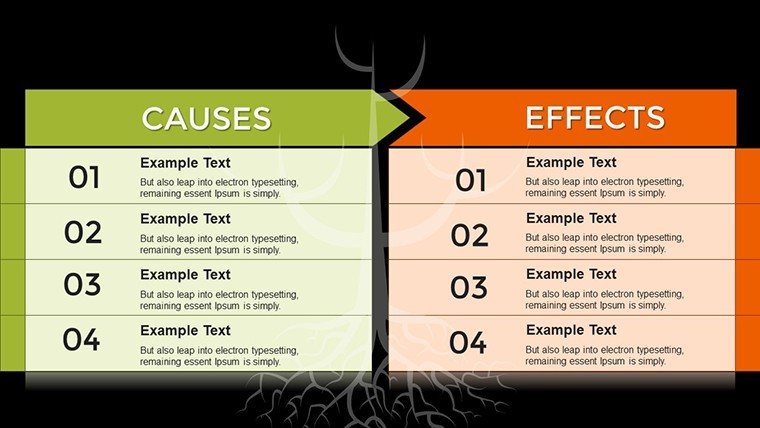
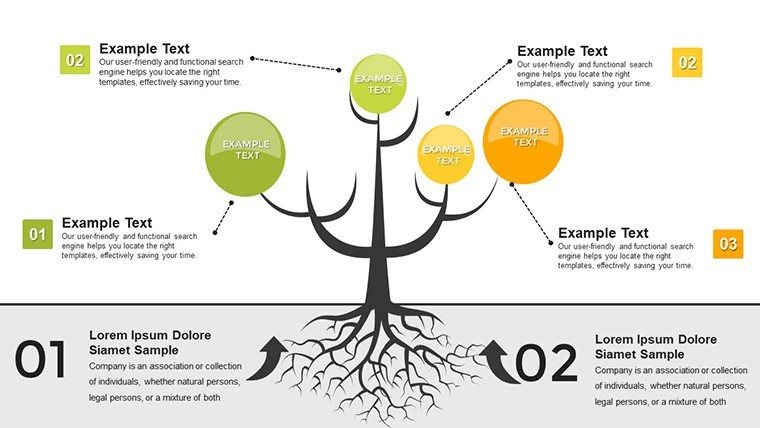
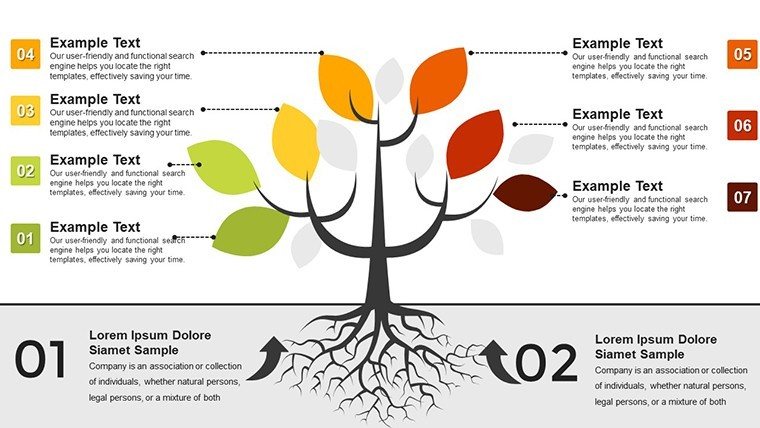
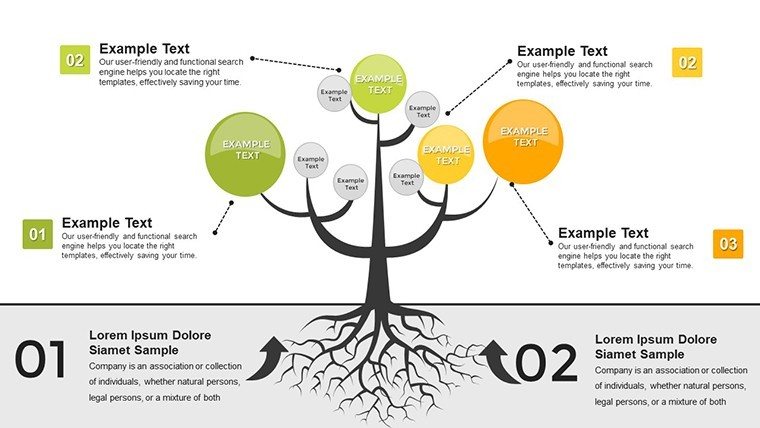
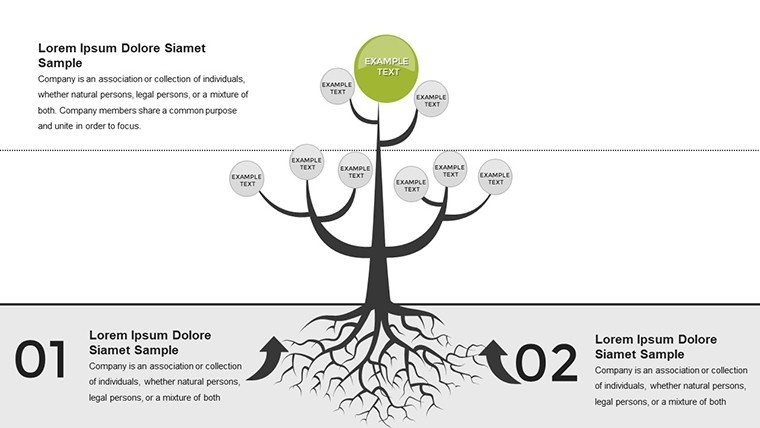
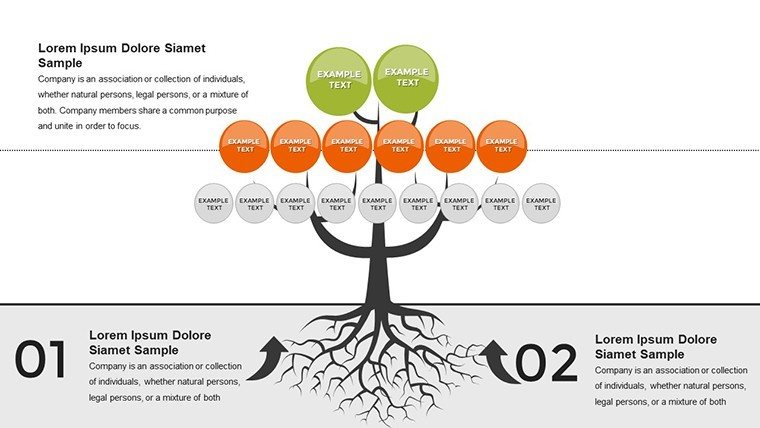
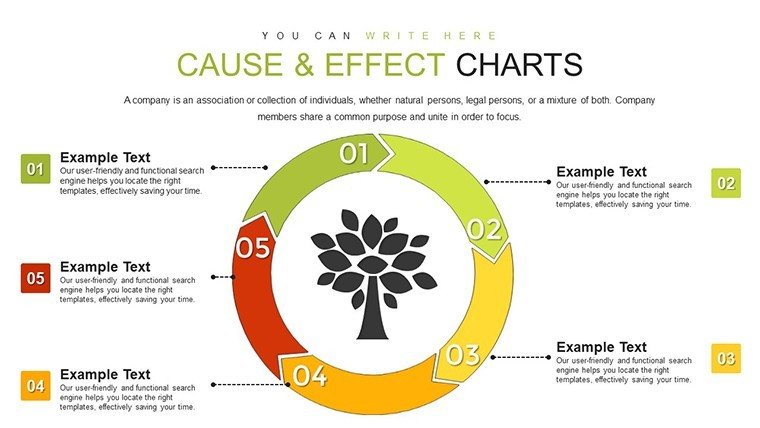
Understanding cause-and-effect relationships is essential for sound decision-making, and our Cause and Effect Tree PowerPoint Charts template makes it intuitive. Boasting 38 editable slides, it uses tree structures to branch out causes from effects, perfect for business analysts dissecting market shifts or educators explaining scientific phenomena. Think of it as a visual detective tool: Root causes at the base, branching into effects with clear hierarchies. This empowers professionals to uncover hidden connections, like how supply chain disruptions lead to revenue dips, fostering proactive strategies. With its elegant design, this template turns convoluted data into digestible diagrams, sparking 'aha' moments in boardrooms and classrooms alike.
Branching into Clarity: The Tree Structure Advantage
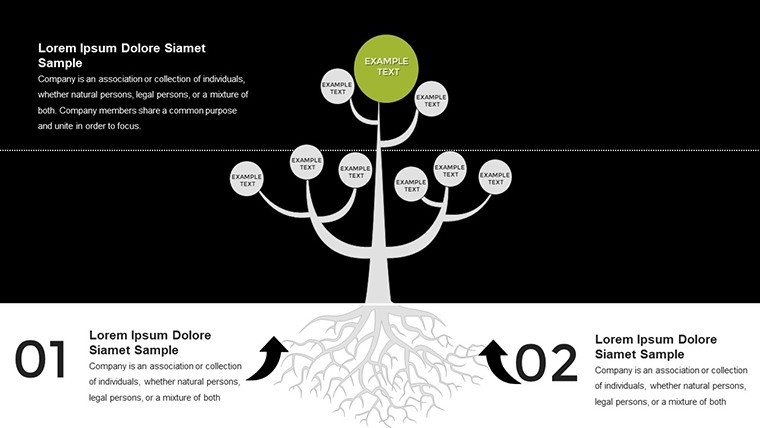
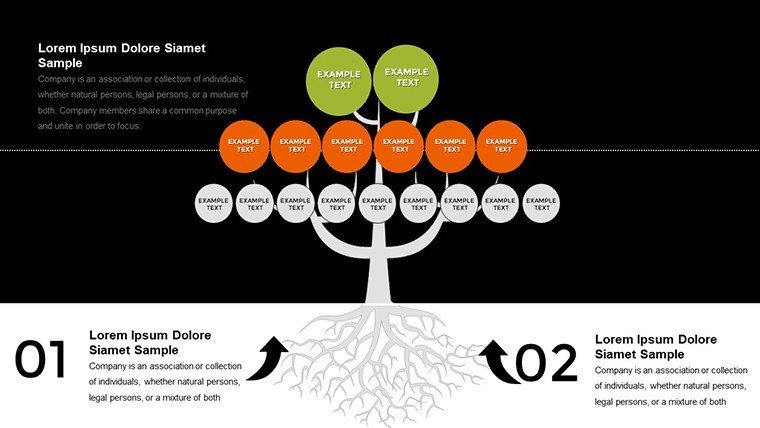
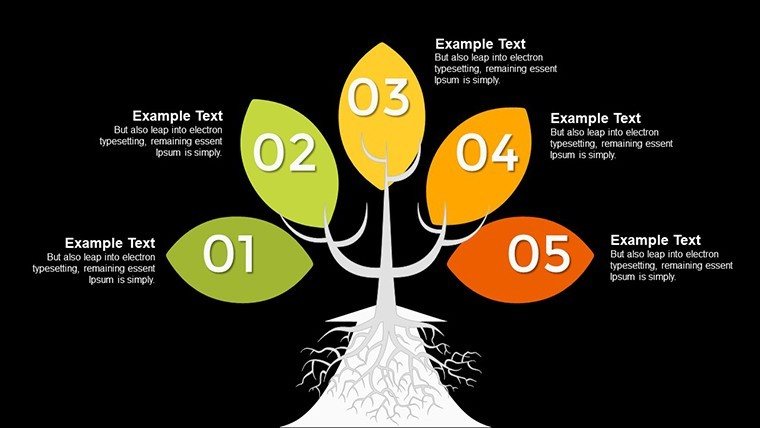
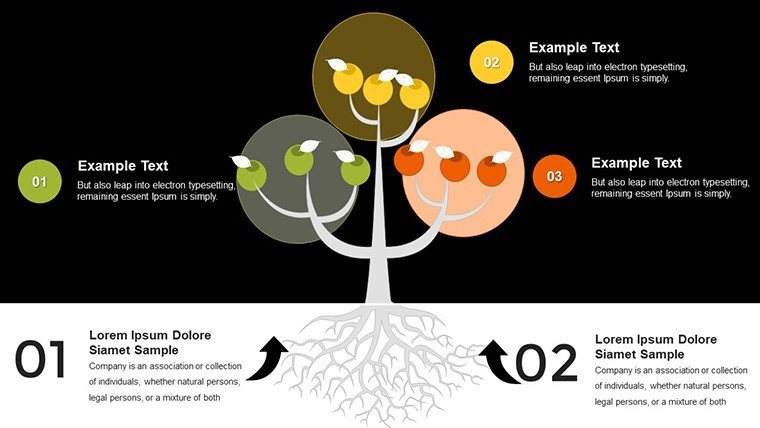
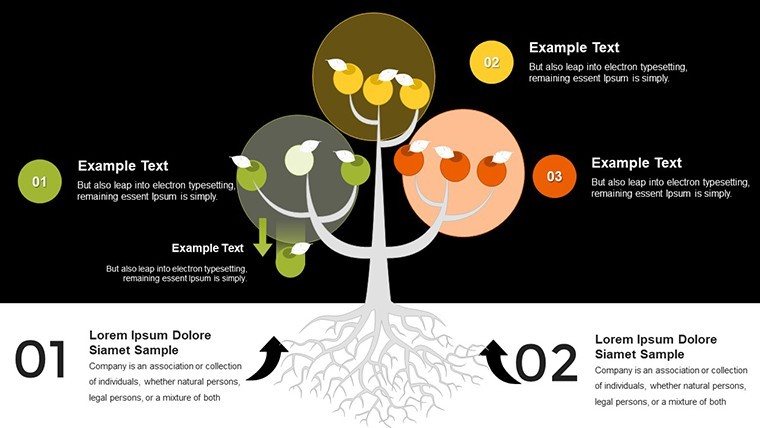
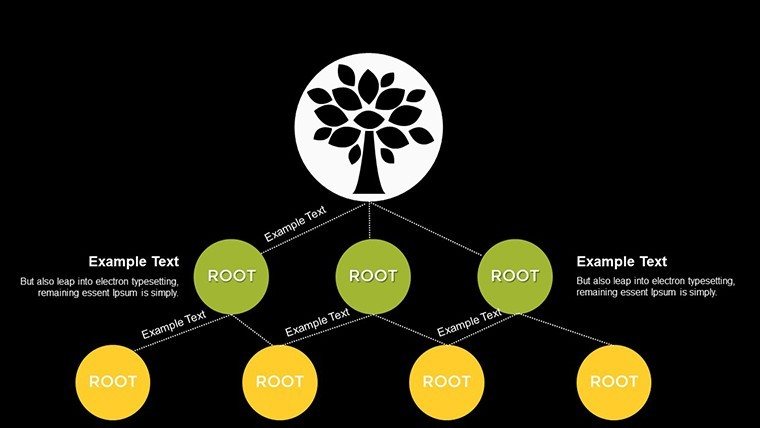
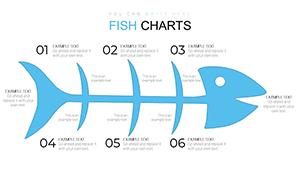
Tree charts excel at hierarchical visualization, mirroring natural growth where roots support expansive branches. This template's designs allow multi-level branching, ideal for Fishbone-like analyses or decision trees. Customize branches with colors coding severity - red for critical causes - or add nodes for sub-effects.
Highlighted Features for In-Depth Analysis
- Hierarchical Tree Layouts: From simple binaries to complex multi-branches, suiting varied depths.
- Editable Nodes and Labels: Adjust text, shapes, and connections for precise representation.
- Animation Sequences: Unveil branches progressively to build logical narratives.
- Data Visualization Tools: Integrate charts within branches for quantitative backing.
- Brand Consistency Options: Full control over aesthetics to align with your style.
Elevating beyond basic diagrams, it incorporates best practices from quality management, like Ishikawa diagrams.
Versatile Applications in Professional Arenas
For strategic planning, map economic factors causing market volatility, branching into mitigation strategies. Educators can use it for biology lessons, treeing out ecosystem disruptions from pollution. Researchers might analyze study variables, with trees revealing confounding factors.
A practical case: In project post-mortems, teams trace delays to root issues like resource allocation, using the template to prevent recurrences, as seen in agile methodologies.
Step-by-Step Customization for Effective Trees
- Outline Your Structure: Identify core cause-effect pairs; choose slides accordingly.
- Build the Tree: Add branches via simple drags; label clearly.
- Enhance with Data: Embed metrics or icons for visual punch.
- Animate Growth: Set sequences to mimic causal unfolding.
- Refine and Iterate: Solicit input, adjust for accuracy.
Insight: Keep branches balanced to avoid visual bias, per data viz experts like Few.
Leveraging Expertise for Robust Visuals
Rooted in analytical frameworks from Six Sigma, this template ensures authoritative outputs. PMI studies affirm tree charts boost problem-solving efficiency. Compatible with collaborative platforms, it's ideal for remote teams.
Combine with other models for hybrid analyses, enriching your toolkit.
Conquering Analytical Obstacles
Overly complex trees are streamlined by modular designs, ensuring scalability. For diverse fields, adapt terminology for audience resonance.
Its intuitive interface builds confidence, turning novices into adept analysts.
Harvest the Benefits of Clear Causality
Plant the seeds of insight with our Cause and Effect Tree template. 38 slides for your exploration - customize and conquer complexities. Act now - secure this powerhouse!
Frequently Asked Questions
How detailed can the tree branches get?
Up to multiple levels, with editable nodes for comprehensive breakdowns.
Is it useful for qualitative analysis?
Yes, labels and icons support non-numeric insights effectively.
Can I export to other formats?
Sure, convert to PDF or images for reports.
What distinguishes it from mind maps?
Focused on causality with directed branches, unlike associative maps.
Are there built-in examples?
Slides include placeholders; customize with your scenarios.
Good for
- Project roadmaps and sprint plans
- Product launch timelines
- Quarterly or annual review decks
- Company history and milestone summaries
Licence
reviews
Downloaded this before class and the charts saved me time.
The layout spacing was better than I expected.
Some pages felt too crowded but easy to clean up.
I liked the darker colors on the graph slides.
Pretty straightforward PowerPoint template overall.
FAQ
Will it work in Google Slides?
Are fonts embedded?
Can I use this for client work?
What's the refund policy?
Do you update the template after purchase?
Similar templates
See all PowerPoint Charts →
All 38 slides