 Click to zoom
CAC and LTV PowerPoint Charts Template
| Format | .pptx |
| Slides | 41 unique layouts |
| Aspect ratio | 130/73 |
| Compatibility | PowerPoint |
| Animated | No |
| Language | English |
| License | Commercial |
| File size | — |
| Version | v1.0 |
| Last updated | May 2026 |
What's inside
Unit economics and growth reviews
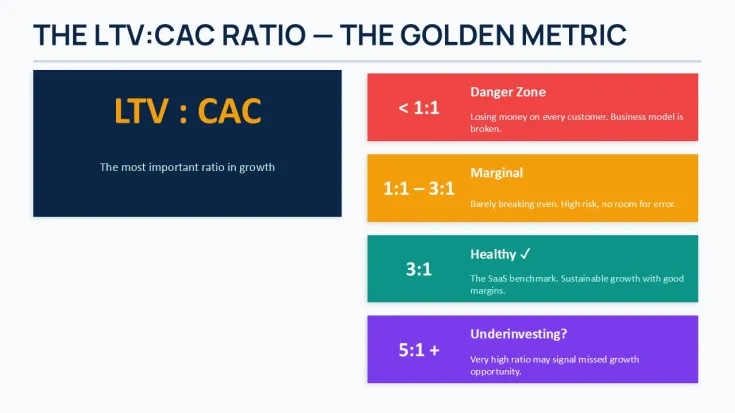
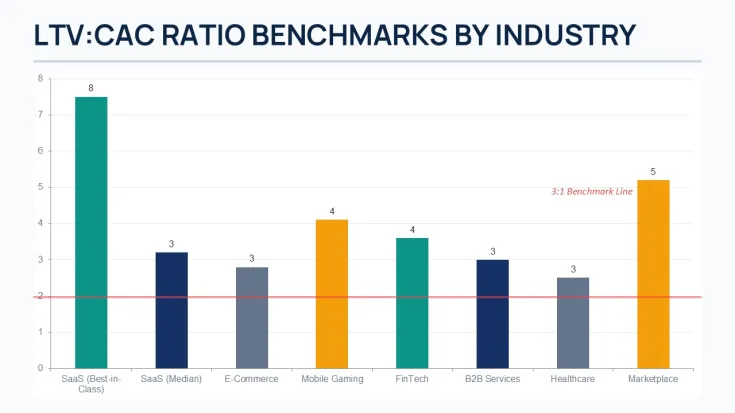
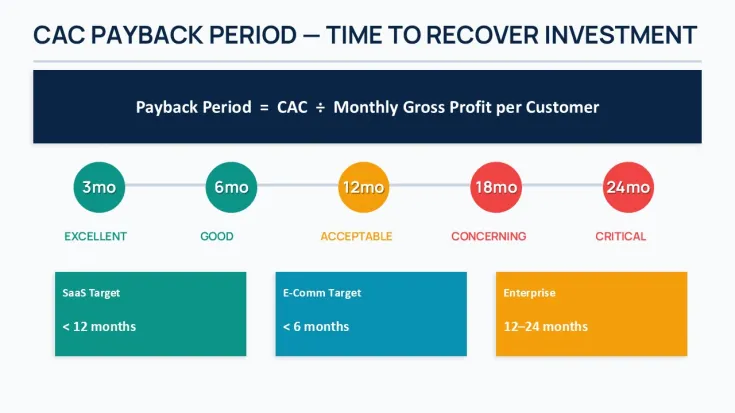
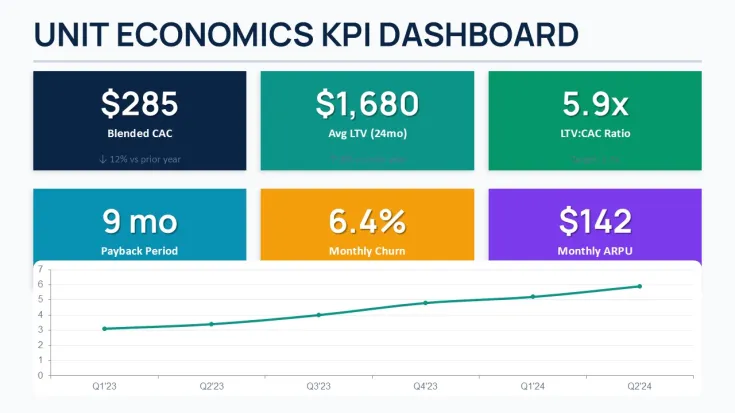
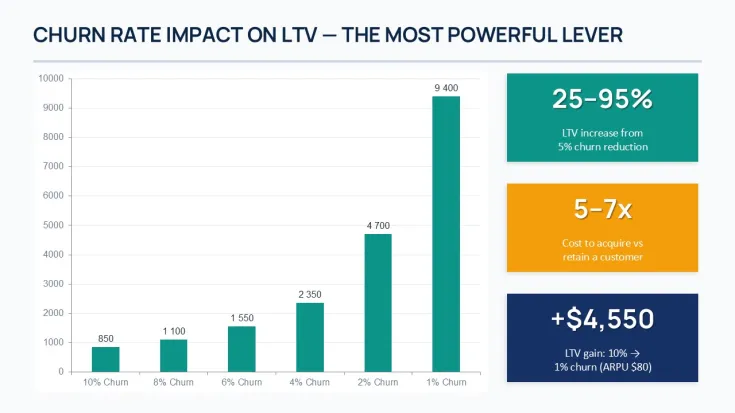
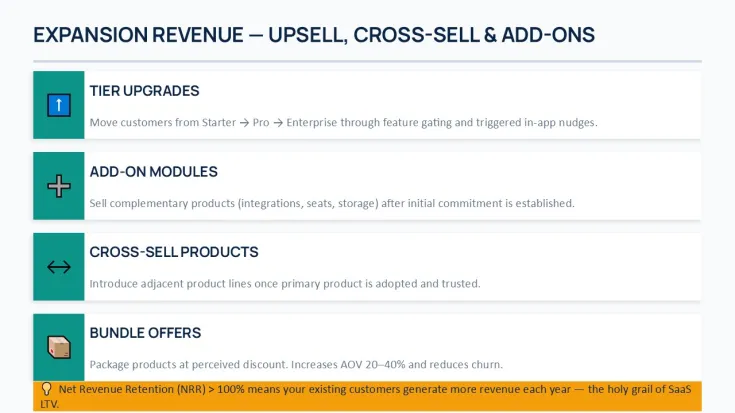
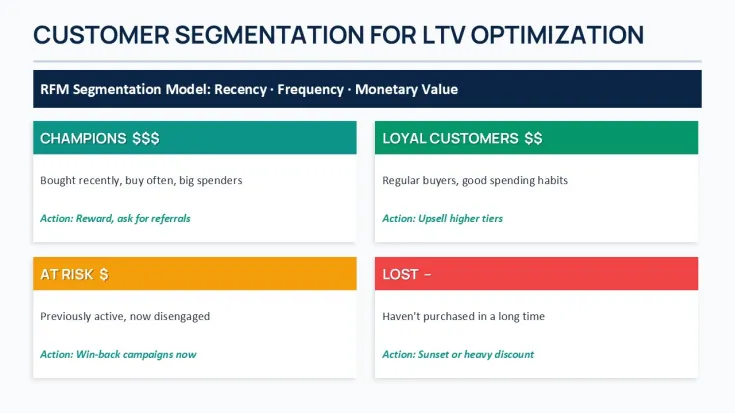
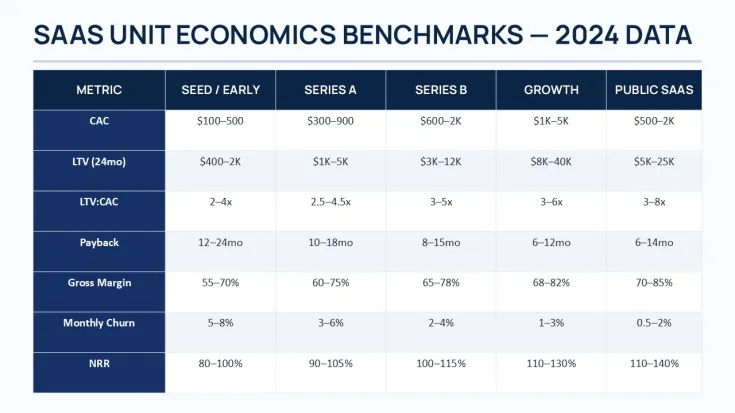
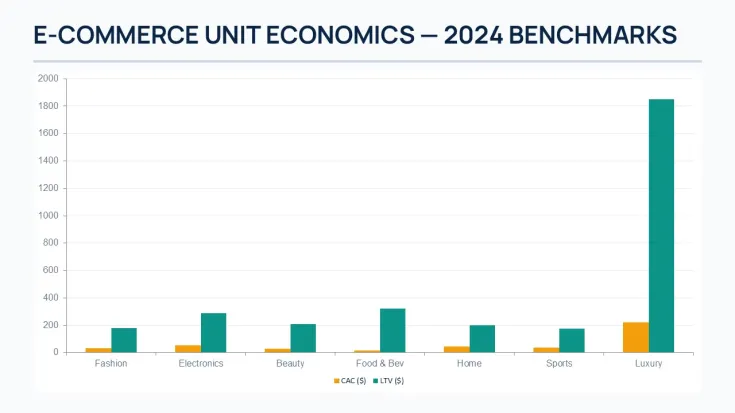
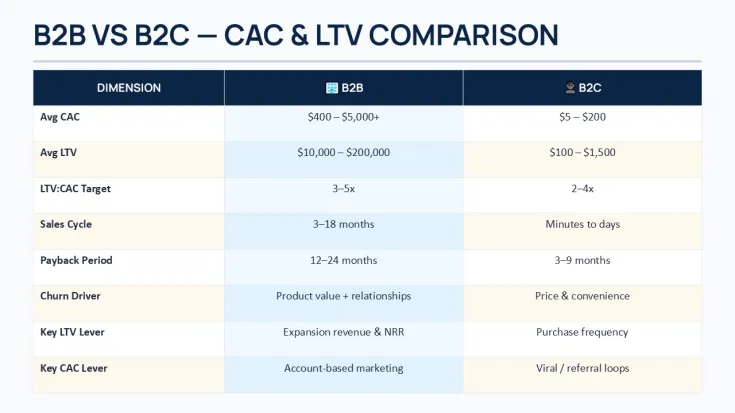
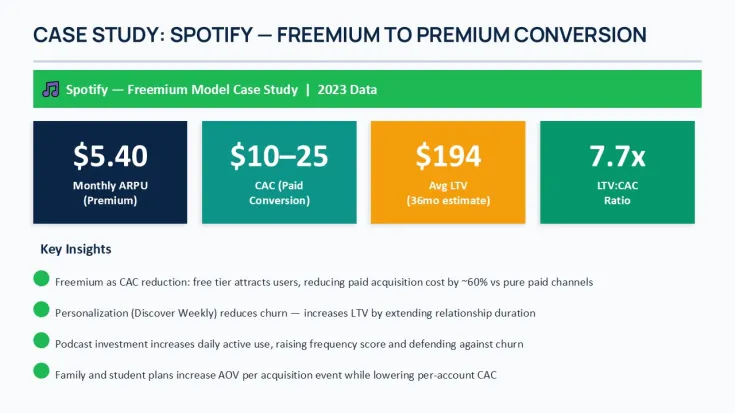
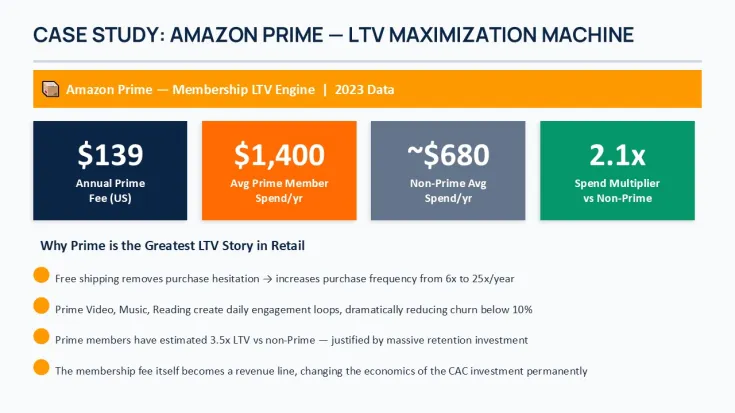
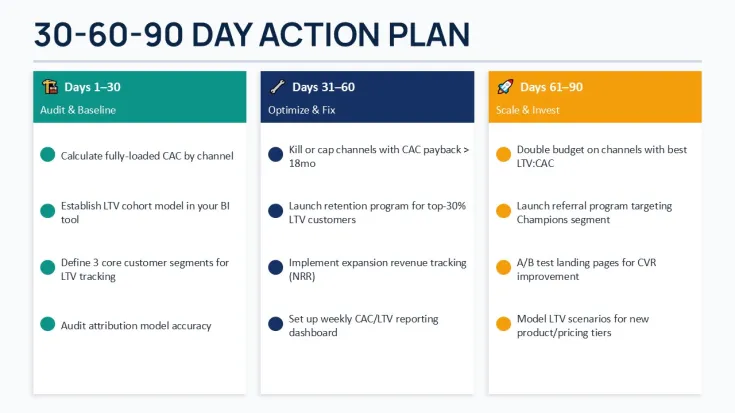
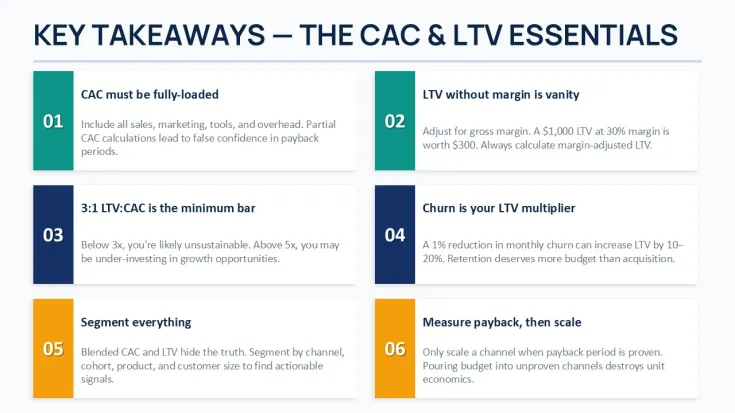
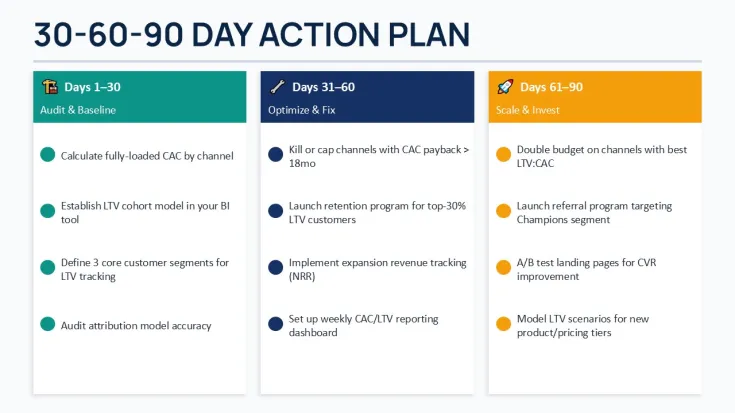
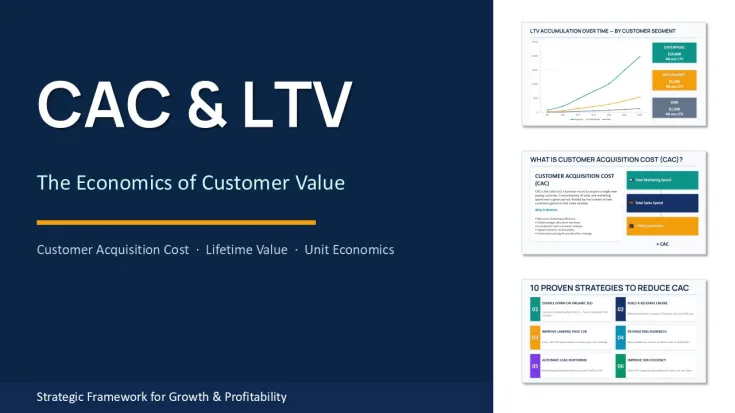
This 41-slide PowerPoint template turns customer value numbers into visuals a leadership team can actually discuss. The layered layouts show payback periods visually and separate paid versus organic channels without extra work. The column alignment holds when you swap in real monthly data.
Customer lifetime value diagrams vs basic bar charts
Standard graphs hide the relationship between acquisition spend and customer return. The customer lifetime value diagrams here use layered layouts that show payback periods visually. The acquisition cost visuals separate paid versus organic channels without extra work. The ratio indicators resize cleanly and recolor through the theme.
Technical advantages
- Native data sheets update linked charts automatically.
- Individual bars, lines and labels resize and recolor independently.
- LTV payback curves and segmented acquisition cost visuals included.
- Update the master once and the whole set follows.
Specifications
SlidesFormatEditable elementsColor methodCompatibility41.pptxChart data, line colors, axis labels, legend textSlide Master color themePowerPoint 2016 or newer (Windows/macOS)Frequently Asked Questions
How do I change colors in this CAC and LTV PowerPoint charts template?
Go to View > Slide Master. The main color palette sits at the top. Click any accent color swatch and update it—the customer lifetime value diagrams and LTV CAC ratio slides update across all 41 layouts automatically. In most cases you won't need to touch individual elements.
Can I use these slides for client projects?
Yes. The standard license covers client work as long as the final presentation is delivered as a flattened PDF or protected file. You cannot resell the .pptx source itself.
What are the differences between free and paid versions?
This paid version includes the full 41 editable slides with all customer value economics charts. Free samples on the site usually give you 4–6 slides. The paid set has the complete LTV payback curves and segmented acquisition cost visuals needed for board discussions.
Good for
- Project roadmaps and sprint plans
- Product launch timelines
- Quarterly or annual review decks
- Company history and milestone summaries
Licence
reviews
The CAC to LTV ratio chart helped me explain our startup burn rate to investors in a way they finally understood.
I used the customer acquisition funnel to show where our marketing budget was leaking.
The payback period graph is very clear and easy to update with our monthly data.
I wish the color for customer value was more distinct from the acquisition cost.
Its a solid pack for any SaaS company doing investor updates.
FAQ
Will it work in Google Slides?
Are fonts embedded?
Can I use this for client work?
What's the refund policy?
Do you update the template after purchase?
Similar templates
See all PowerPoint Charts →



All 41 slides