 Click to zoom
Business Comparison Charts PowerPoint Template | 21 Fully Editable Slides
| Format | .pptx |
| Slides | 21 unique layouts |
| Aspect ratio | 16:9 |
| Compatibility | PowerPoint |
| Animated | No |
| Language | English |
| License | Commercial |
| File size | — |
| Version | v1.0 |
| Last updated | February 2026 |
What's inside
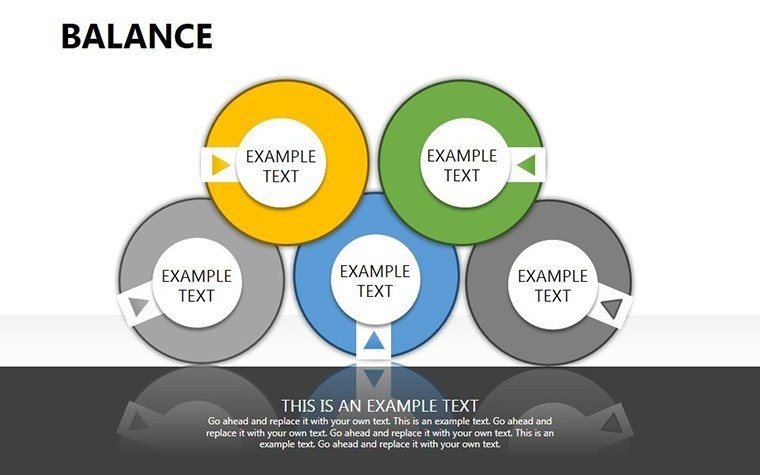
Presenting balanced perspectives in strategy reviews, financial comparisons, or project evaluations requires visuals that immediately convey equilibrium and trade-offs. The Balance PowerPoint Charts Template offers 21 editable slides designed for side-by-side comparisons, pros-and-cons analysis, and multi-factor evaluations during executive briefings, investor presentations, and departmental planning sessions.
Finance directors, strategic planners, and project managers use these charts to present risk versus reward scenarios, compare quarterly performance, or evaluate competing vendor proposals. The templates help convey complex data clearly and objectively, making stakeholder decisions easier and faster.
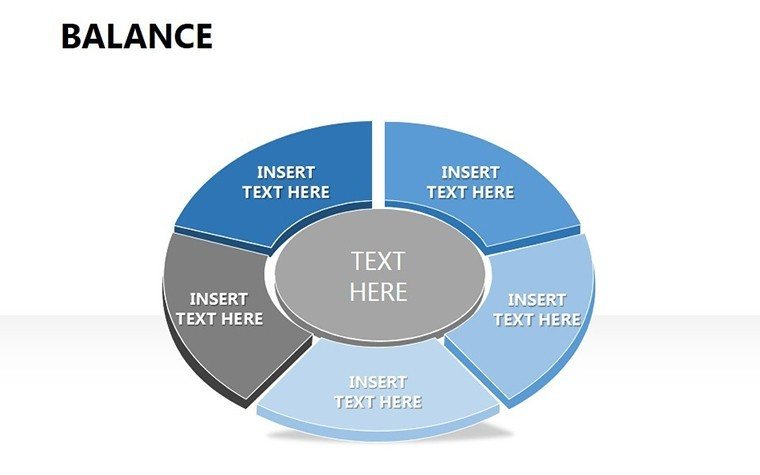
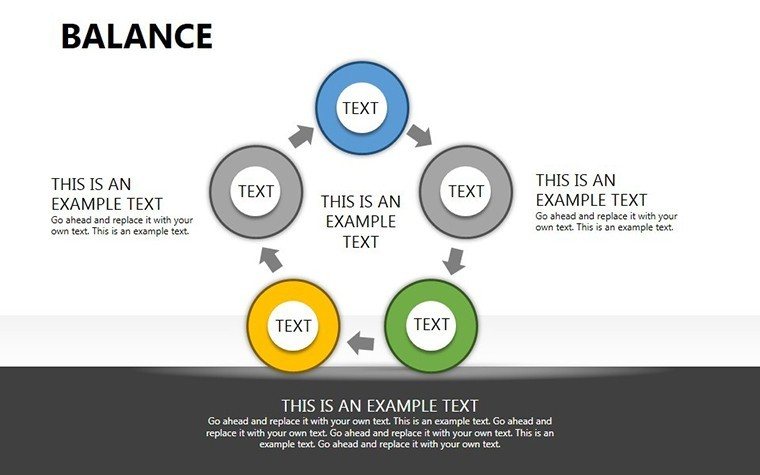
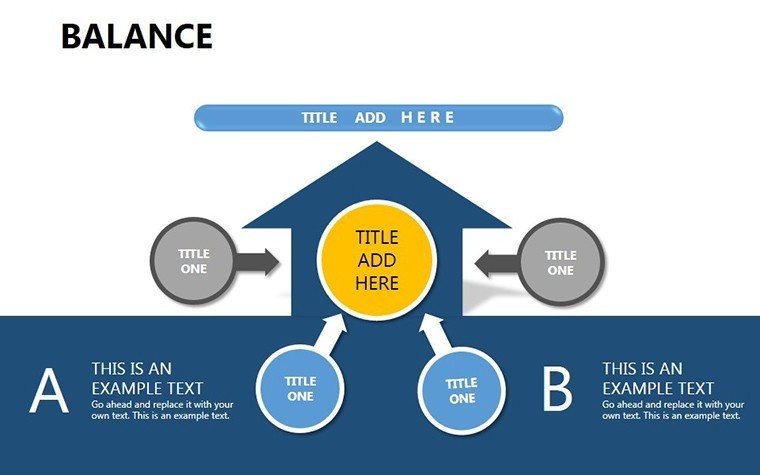
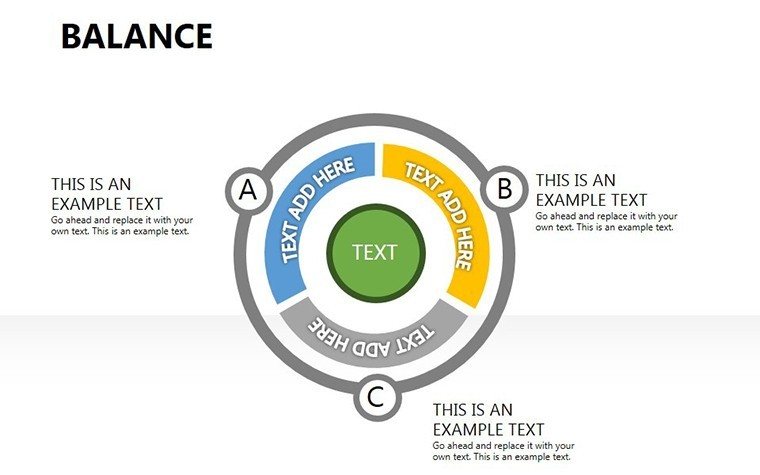
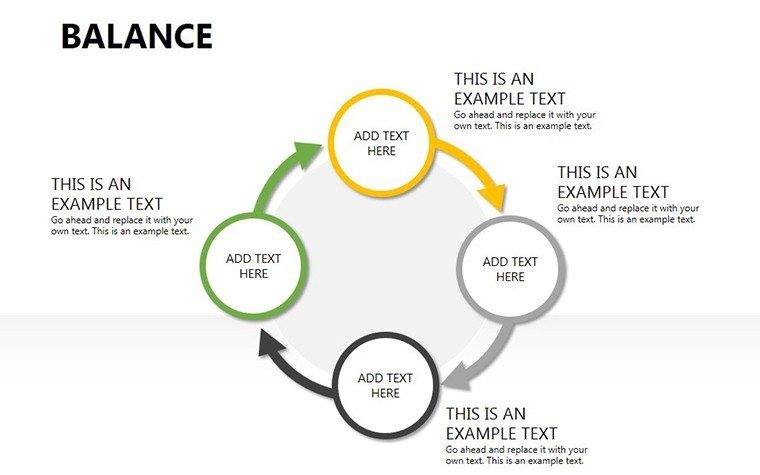
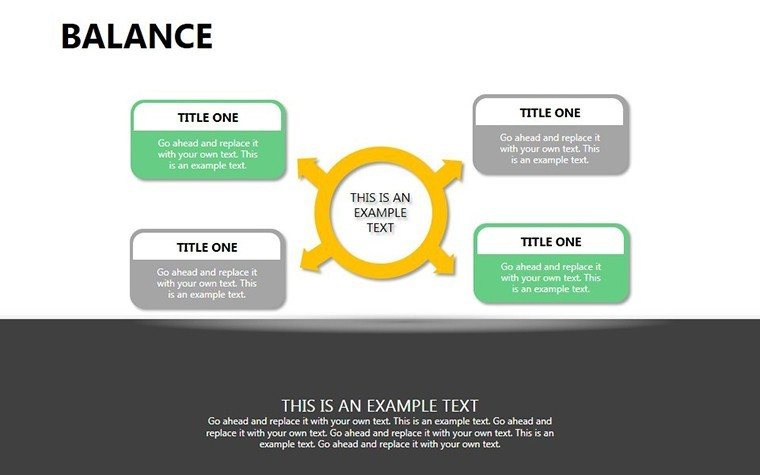
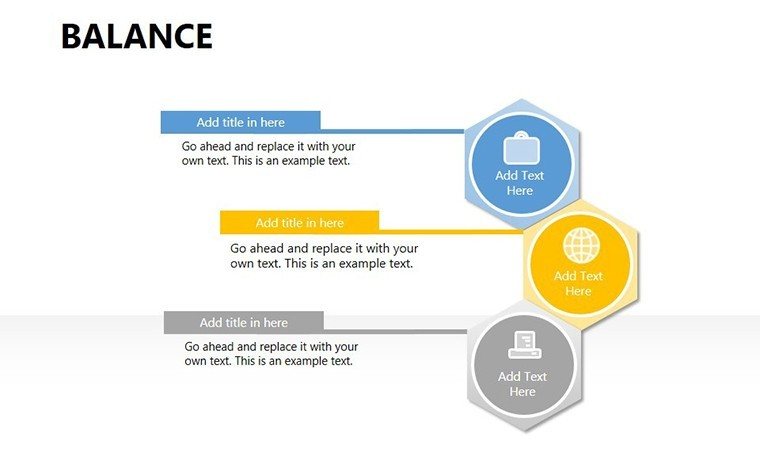
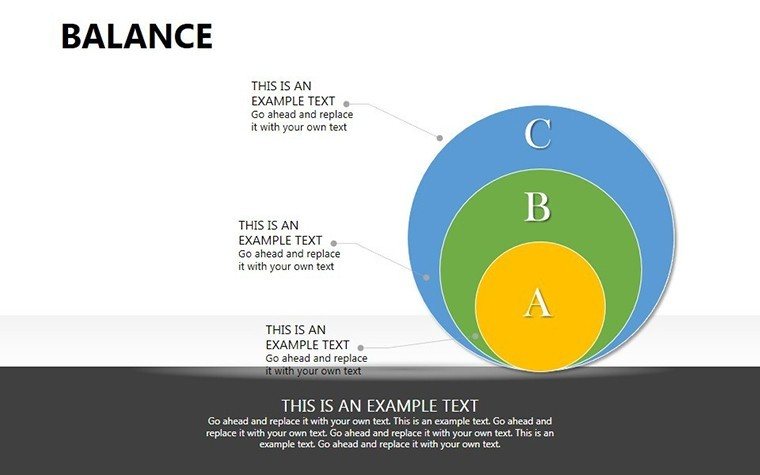
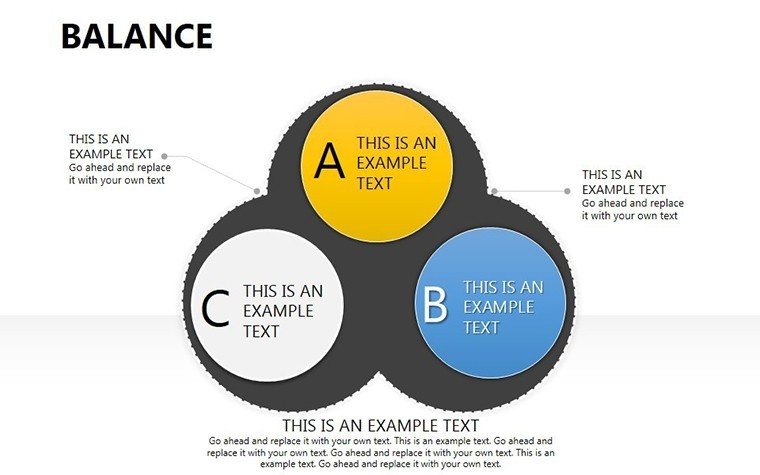
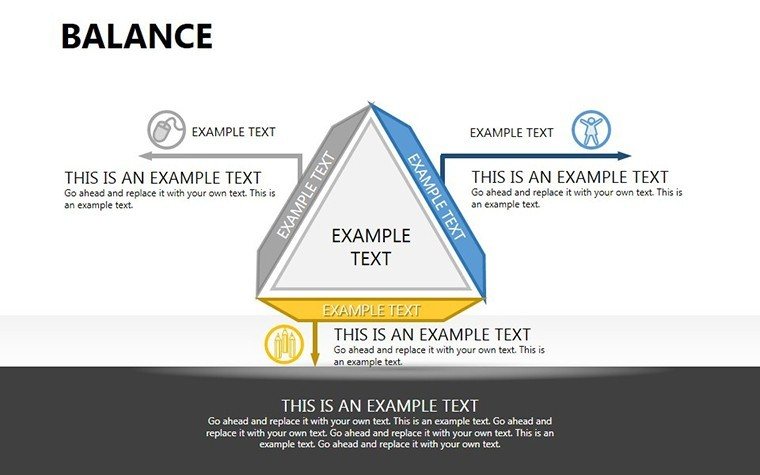
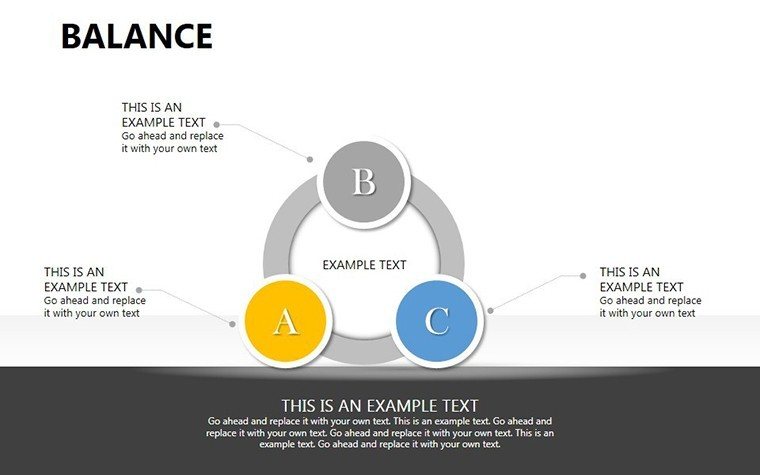
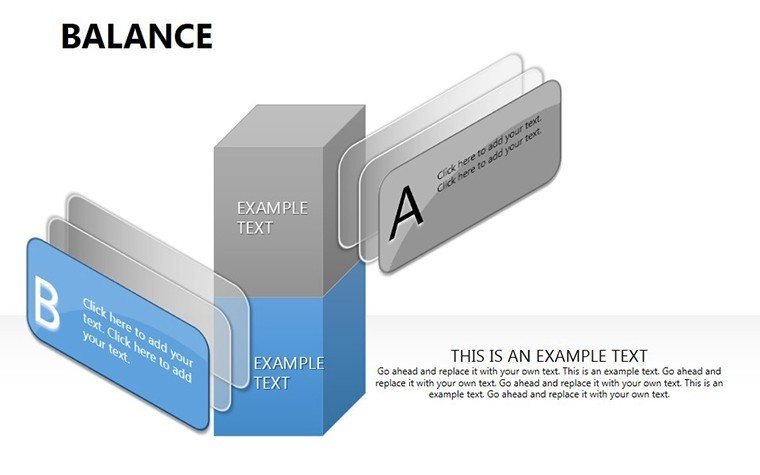
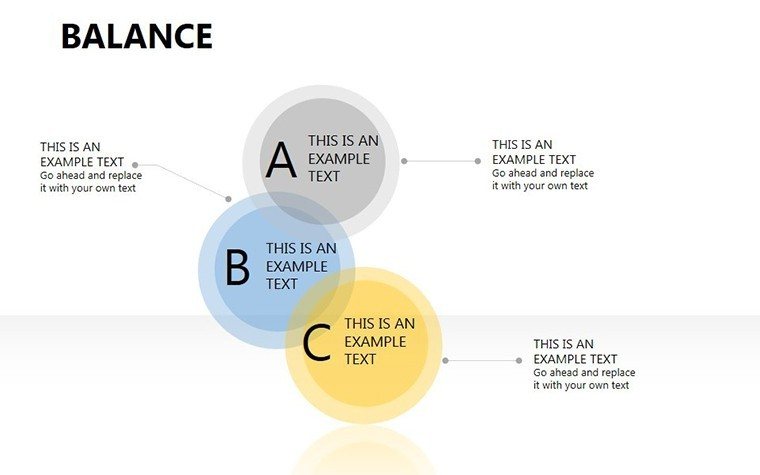
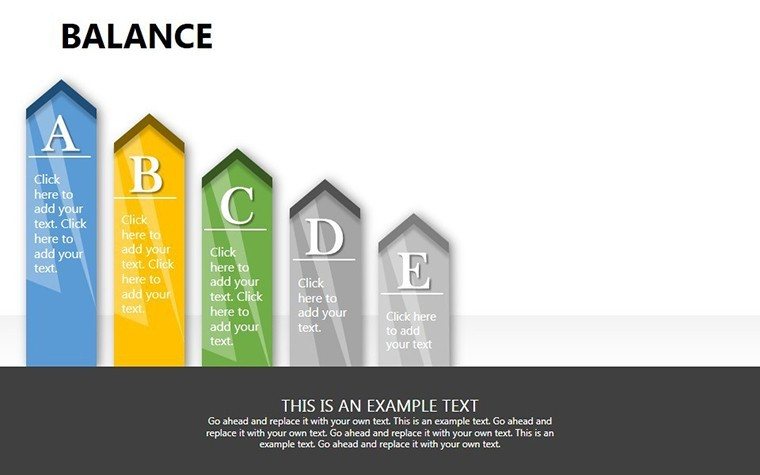
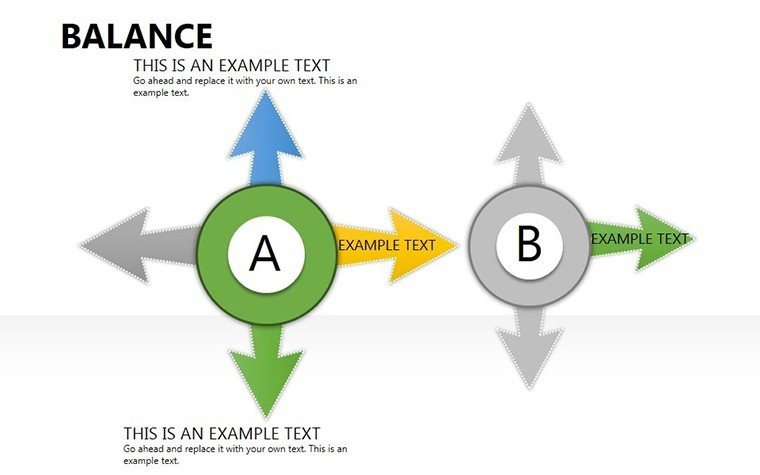
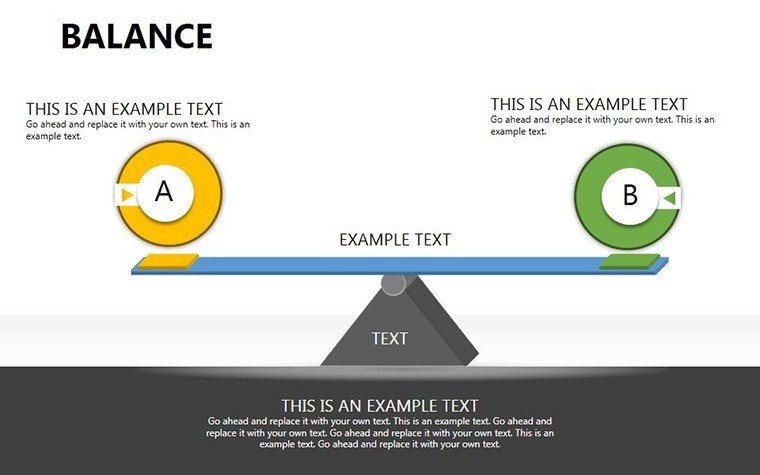
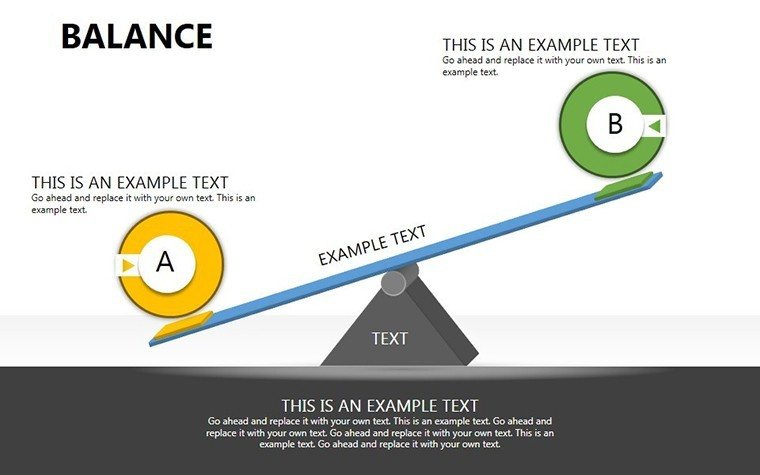
Comprehensive Chart Variations: Includes scale balance diagrams, circular balance wheels, side-by-side tables, arrow-based trade-off charts, and pyramid structures. Each format fits distinct scenarios, from simple two-factor comparisons to multi-criteria evaluations.
Strategic Use Cases: CFOs present budget allocation, product managers prioritize features, HR directors compare compensation packages, and operations managers evaluate process improvements using these templates. Visual balance ensures informed, unbiased decision-making.
Customization Workflow: Open the PPTX file, replace placeholder text with your factors, and adjust visuals like scale tilt to reflect relative advantages. Perfect for presenting investment options, make-versus-buy decisions, or operational trade-offs.
What software do I need to edit this template?You need Microsoft PowerPoint 2016 or later, or any compatible software that supports .PPTX files. All slides are fully editable.
Can I use these charts for investor presentations?Yes, these balance charts are designed for executive and investor presentations, allowing clear comparison of strategic options, financial data, and project trade-offs.
Are the slides customizable for multiple factors?Absolutely. Circular balance wheels and arrow-based trade-off charts accommodate multi-factor evaluations, making them ideal for complex decision-making scenarios.
Is this template suitable for internal operations reviews?Yes, operations managers use these slides to evaluate process improvements, resource allocation, and efficiency gains, providing a clear visual balance for internal decision-making.
Good for
- Project roadmaps and sprint plans
- Product launch timelines
- Quarterly or annual review decks
- Company history and milestone summaries
Licence
reviews
The pie charts looked decent once I added my own numbers.
Pretty normal template but better than building slides from zero.
I was rushing to finish a statistics presentation and these graphs saved me a lot of time.
The template opened correctly without messing up the fonts which happens to me sometimes.
Some colors were too bright for my taste but the chart structure itself was solid.
FAQ
Will it work in Google Slides?
Are fonts embedded?
Can I use this for client work?
What's the refund policy?
Do you update the template after purchase?
Similar templates
See all PowerPoint Charts →

All 21 slides