 Click to zoom
Break-even Analysis PowerPoint - Editable PPTX
| Format | .pptx |
| Slides | 45 unique layouts |
| Aspect ratio | 130/73 |
| Compatibility | PowerPoint |
| Animated | No |
| Language | English |
| License | Commercial |
| File size | — |
| Version | v1.0 |
| Last updated | April 2026 |
What's inside
Break-even Point Analysis Template Review
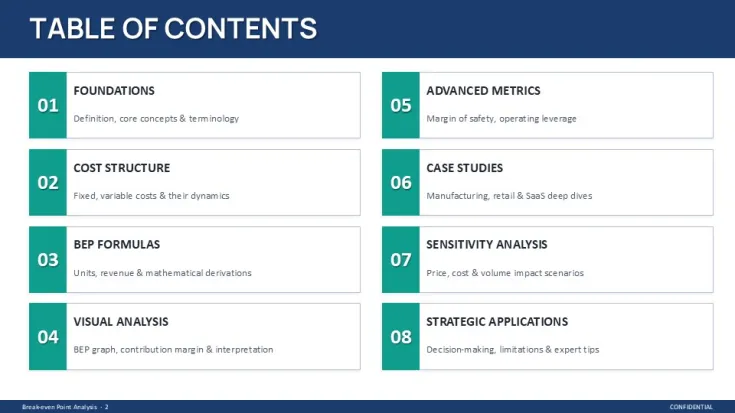
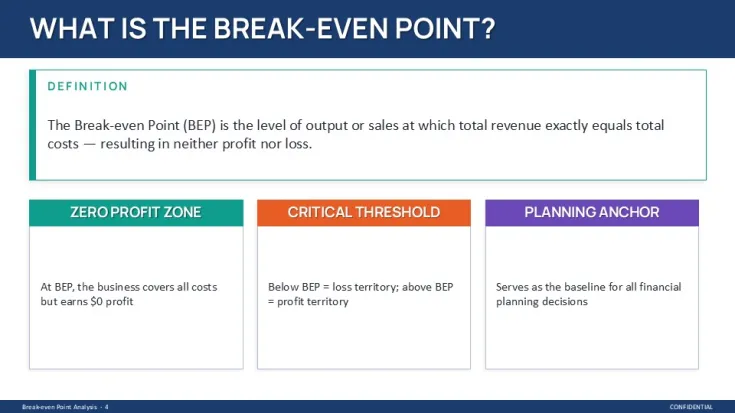
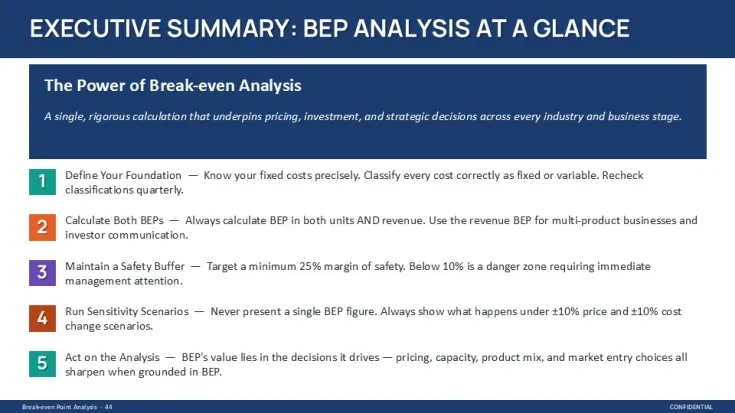
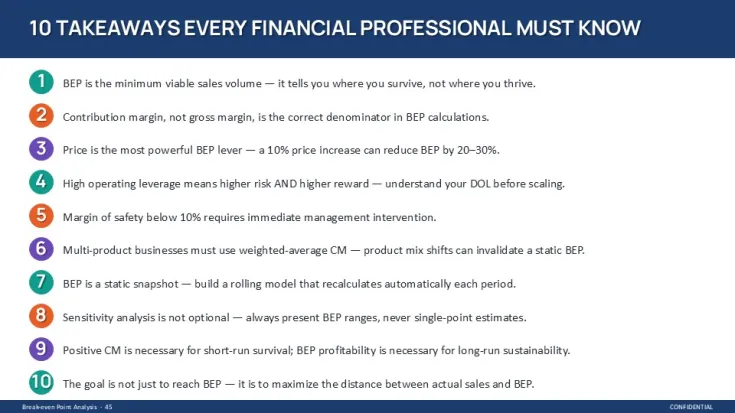
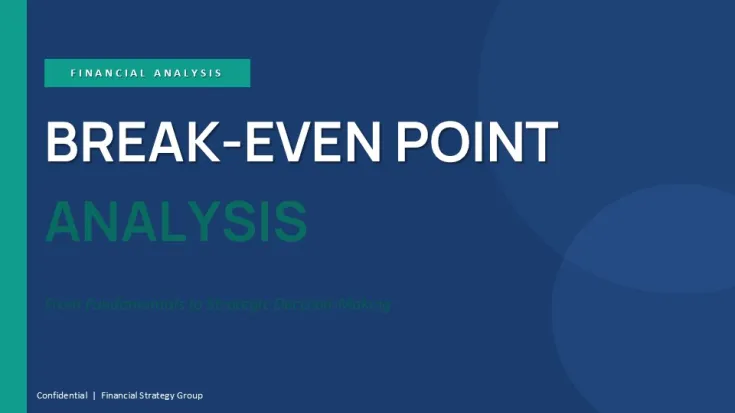
This file is a full deck - 47 slides - and it`s not just a few diagrams thrown together. It walks through break-even logic step by step: definitions, cost structures, formulas, charts, and then into actual scenarios. You open it and it already feels like someone built a proper financial narrative, not just visuals.
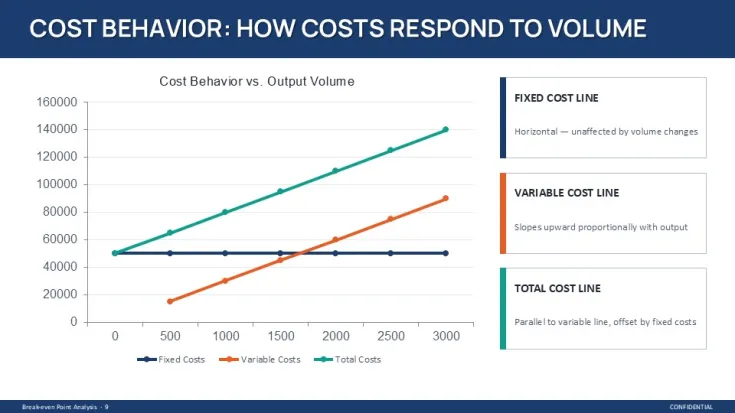
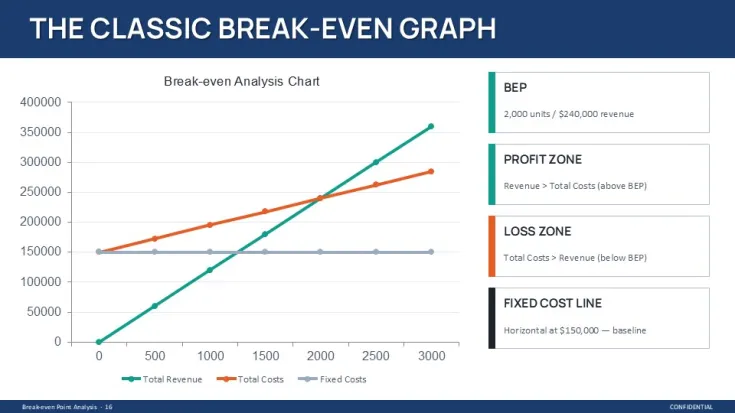
The layouts are mostly horizontal flows and grid-based tables. You`ll see repeated structures: left-aligned text blocks paired with right-side charts, and then full-width data tables. The break-even graph itself uses a simple diagonal revenue line crossing a stepped total cost line, with a flat fixed cost baseline - nothing decorative, just clear geometry. And honestly, the vertical alignment here is what makes it actually usable.
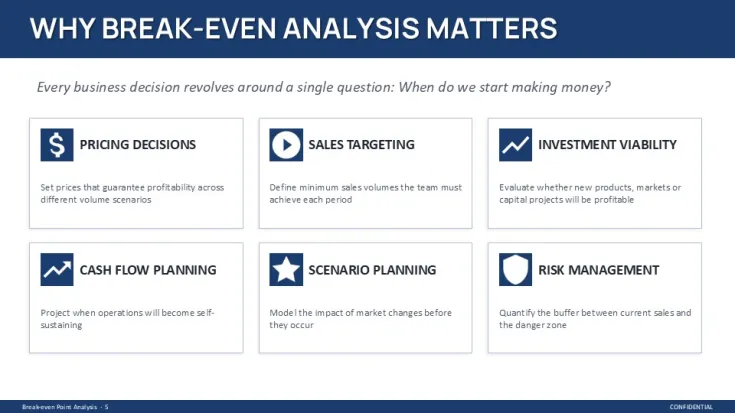
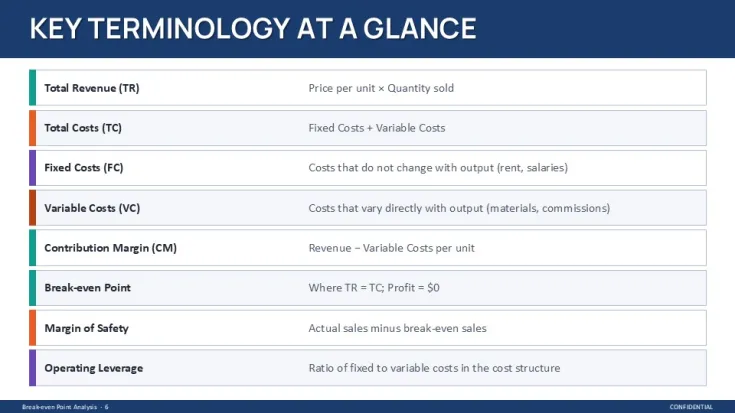
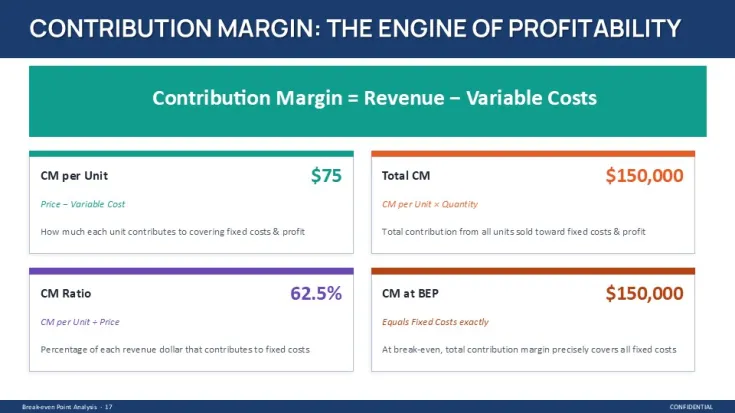
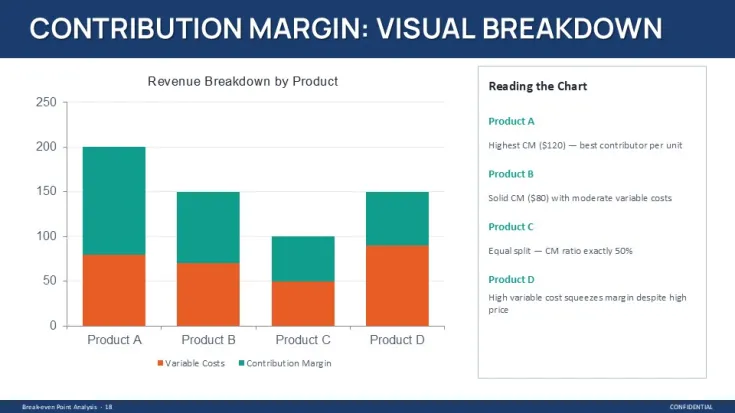
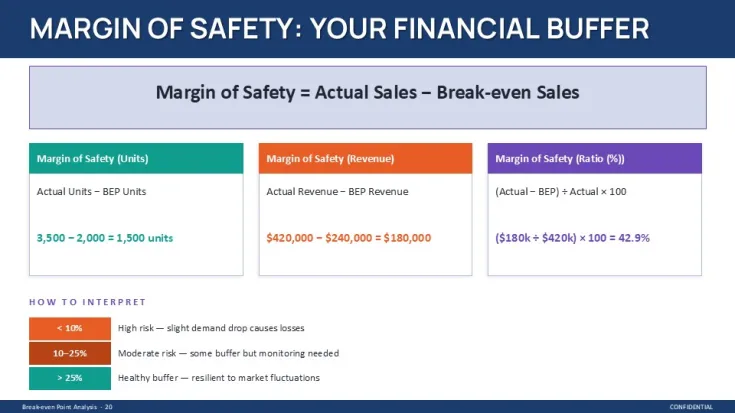
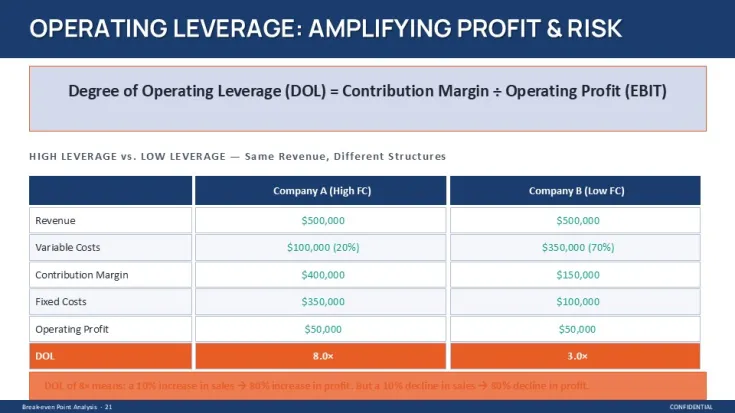
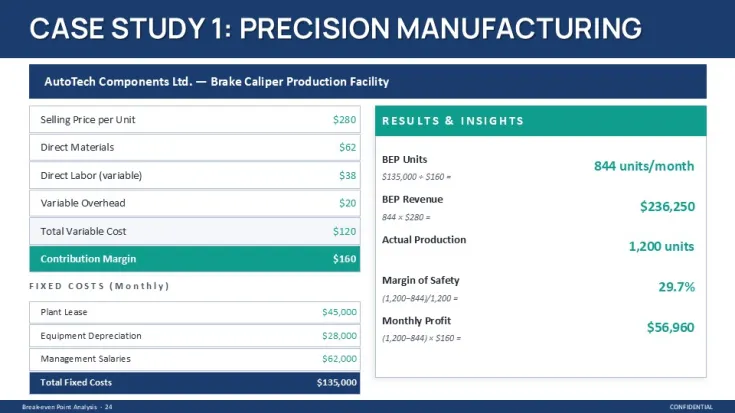
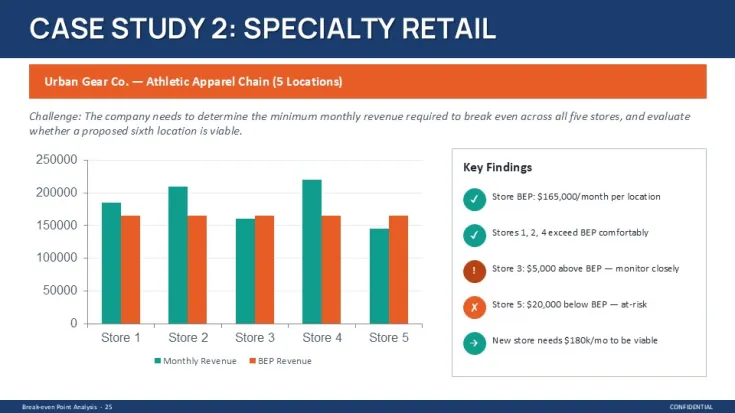
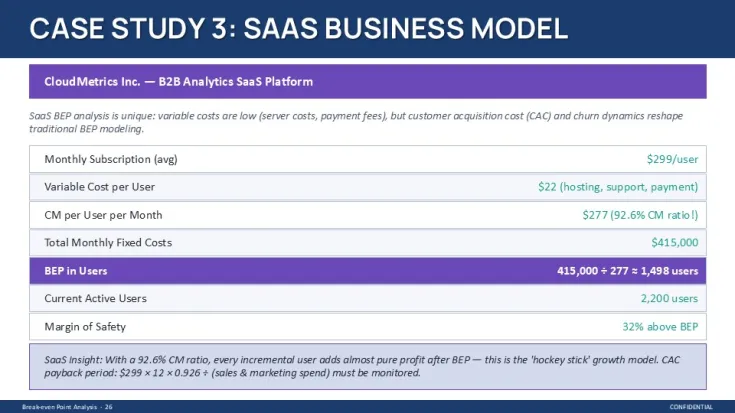
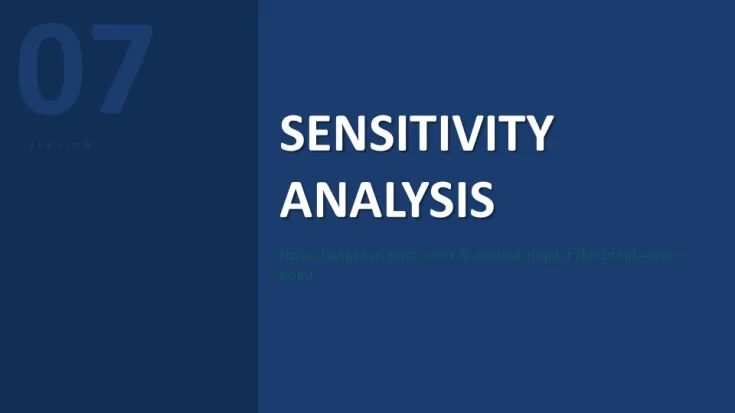
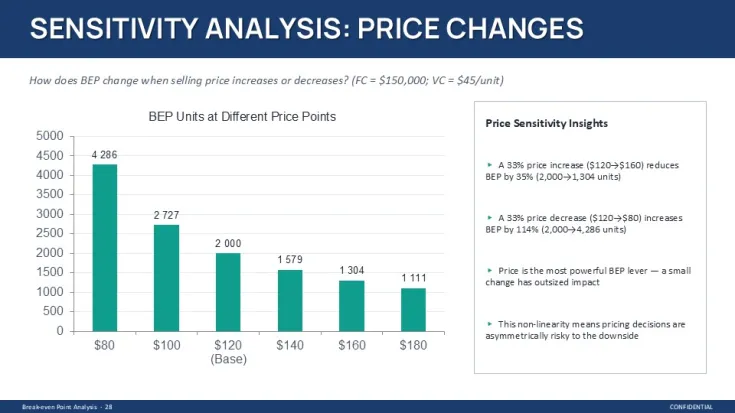
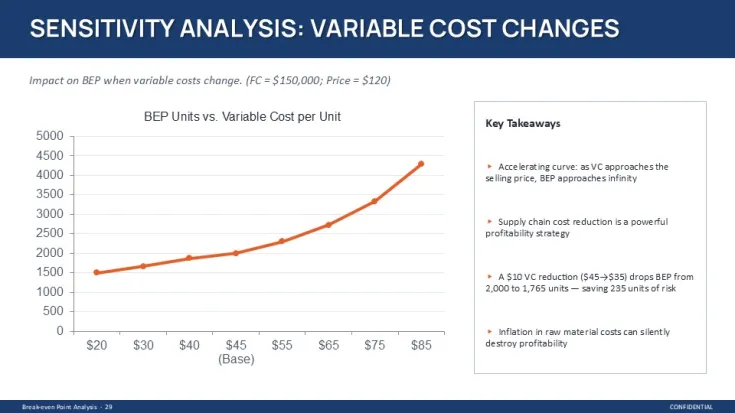
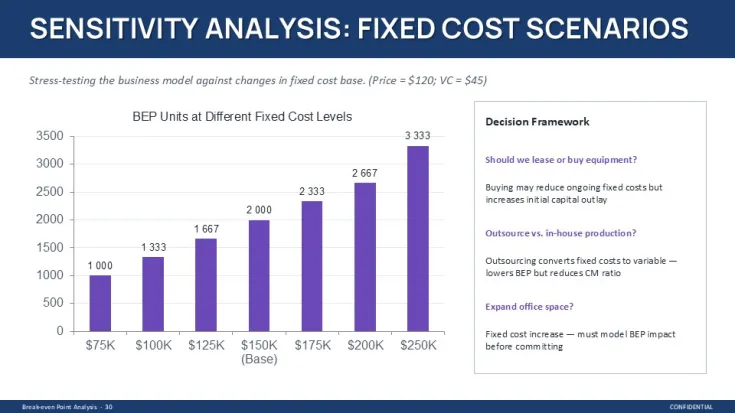
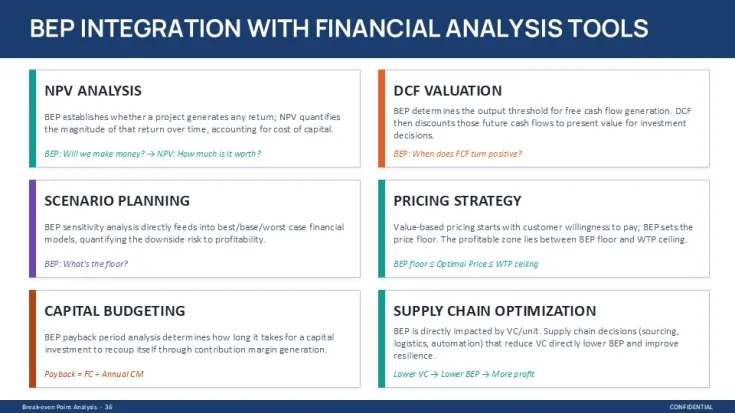
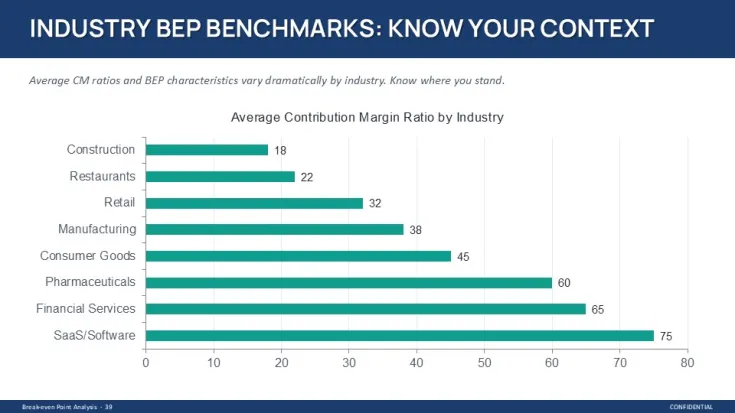
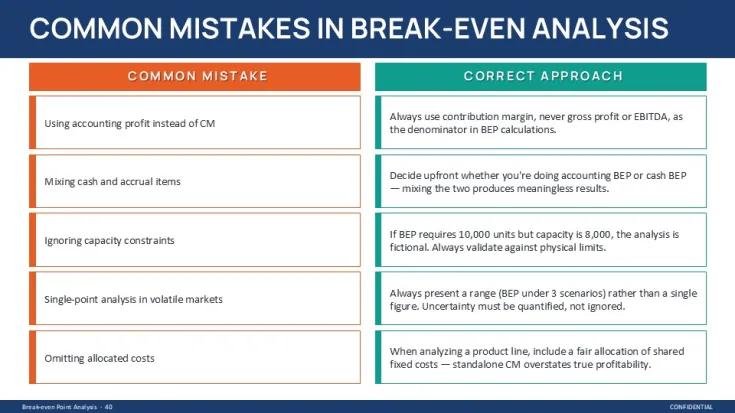
There`s a lot inside. Cost breakdown slides, contribution margin visuals, sensitivity tables, and even case studies (manufacturing, retail, SaaS). The tables are dense but spaced enough to read - columns are evenly distributed, not cramped. Icons are minimal, mostly simple filled or outline shapes, used more like markers than decoration. You drop in your data. That`s it.
But it`s not ideal if you need highly visual storytelling or creative layouts. This is very structured. Works best when you already know your numbers and just need to present them clearly.
The color system is one of the better-built parts - one change in the master and the whole deck updates. That alone saves real time. I always change the colors in the master first before filling in any data. Also, the aspect ratio is 16:9 by default.
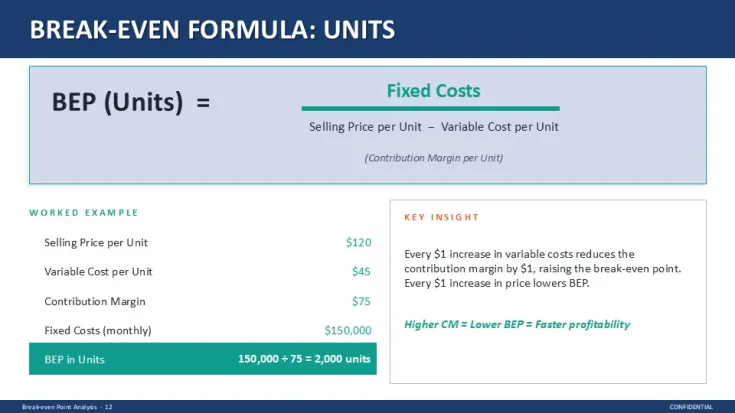
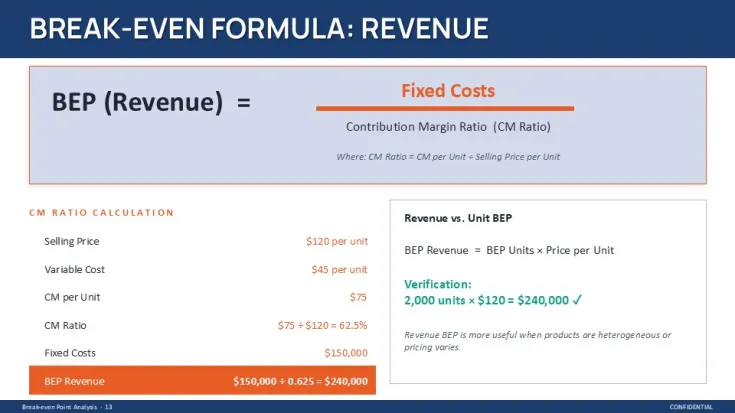
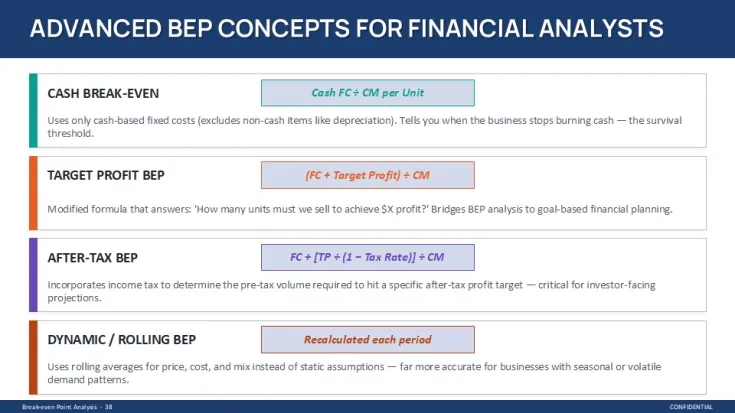
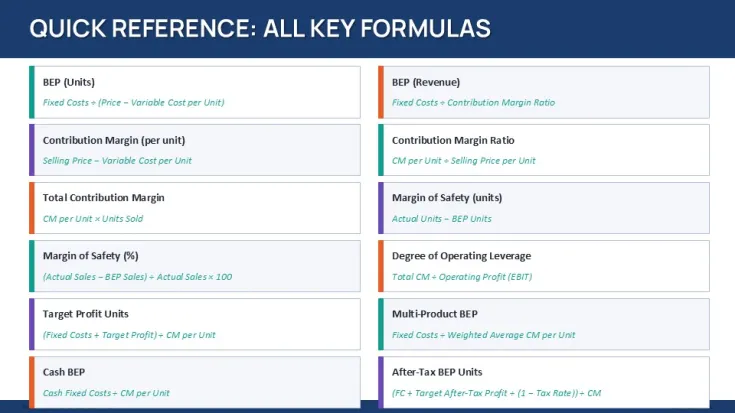
You can use this in a real situation pretty quickly. Say you`re preparing a monthly financial review or pitching a pricing strategy - the BEP formulas and charts are already there. You`re not building anything from scratch. You just replace numbers. Honestly, I just opened it, changed the numbers, and it worked fine.
Took me a second to figure out the layout logic, but after that it's straightforward. The sections follow a strict order - foundations, costs, formulas, analysis - so you don`t really get lost. Slightly annoying at first, then fine.
For analysts, consultants, or finance students, this covers most of what you`d need. The horizontal flow layouts are genuinely well-structured - each step connects without crowding the slide. It`s built for explanation, not decoration. And in practice, that`s what matters here.
And yeah, this is exactly the kind of thing you use when the deck is due tomorrow and you don`t want to rethink structure. Works as-is.
Template Specifications
FeatureDetailsSlides/diagrams47 slides including charts, tables, formulas, case layoutsFile format.pptxSoftware versionPowerPoint 2016+Color schemesMultiple presets via slide master; global switch applies instantlyEditable elementsCharts, tables, text blocks resize independently; data fields replaceableAspect ratio16:9 widescreenFree vs PaidNot specifiedMasters/BackgroundsStructured master slides controlling layout and color systemFAQ
How do I change colors in this template?Go to the slide master view first - that`s where everything is controlled. Find the main theme colors and adjust them there instead of editing slide by slide. The changes apply across the whole deck instantly, including charts and shapes. It`s actually quicker than it looks once you try it.
Can I use this template for client work?It`s the same license most marketplaces use - one buyer, one project, commercial use is fine. You can present it to clients or include it in deliverables. Just don`t resell the template itself. Pretty standard stuff.
What`s the difference between free and paid versions?Honestly, that depends on the specific listing - sometimes the free version includes fewer slides or limited layouts. Paid versions usually unlock the full set with all diagrams and sections. In most cases, you`ll want the full version if you`re using this more than once. That`s basically it.
Can I get a refund if it doesn`t work for me?The short answer is - it depends a bit on the marketplace policy. Usually refunds are allowed if there`s a technical issue or the file doesn`t match the description. Not for change of mind in most cases. Check the specific terms before buying, just to be sure.
Can I apply this design to an existing presentation?So basically, yes - but you`ll need to copy your content into these layouts. The structure is quite specific, so it`s not a one-click apply situation. Usually I just paste text into matching slides and adjust spacing. Oh, and you can also export to PDF from there.
Download and start editing immediately
Good for
- Project roadmaps and sprint plans
- Product launch timelines
- Quarterly or annual review decks
- Company history and milestone summaries
Licence
reviews
Walked through break-even logic step by step for a pricing strategy pitch. The graph with the diagonal revenue line crossing the total cost line is clear geometry nothing decorative.
The sensitivity tables and case studies for manufacturing and SaaS were already built which saved me a ton of time. The sections follow a strict order so you don't really get lost but it felt a bit rigid at first.
Not ideal for creative storytelling but if you already know your numbers and just need to present them clearly this works. The horizontal flows are well-structured and the color system updates the whole deck from the master.
Used this for a monthly financial review and the BEP formulas and charts were already there. Took me a second to figure out the layout logic but after that it was straightforward.
The vertical alignment is what makes this actually usable when you are comparing cost structures side by side. Dropped in my data changed the numbers and it worked fine.
FAQ
Will it work in Google Slides?
Are fonts embedded?
Can I use this for client work?
What's the refund policy?
Do you update the template after purchase?
Similar templates
See all PowerPoint Charts →

All 45 slides