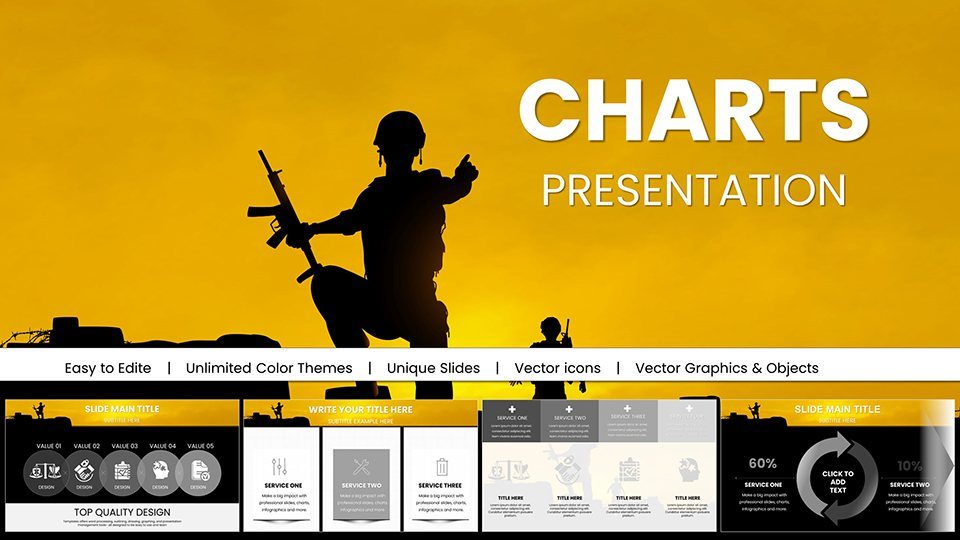
 Click to zoom
Armed Forces PowerPoint Charts for Military Presentation
| Format | .pptx |
| Slides | 59 unique layouts |
| Aspect ratio | 16:9 |
| Compatibility | PowerPoint |
| Animated | No |
| Language | English |
| License | Commercial |
| File size | — |
| Version | v1.0 |
| Last updated | September 2023 |
What's inside
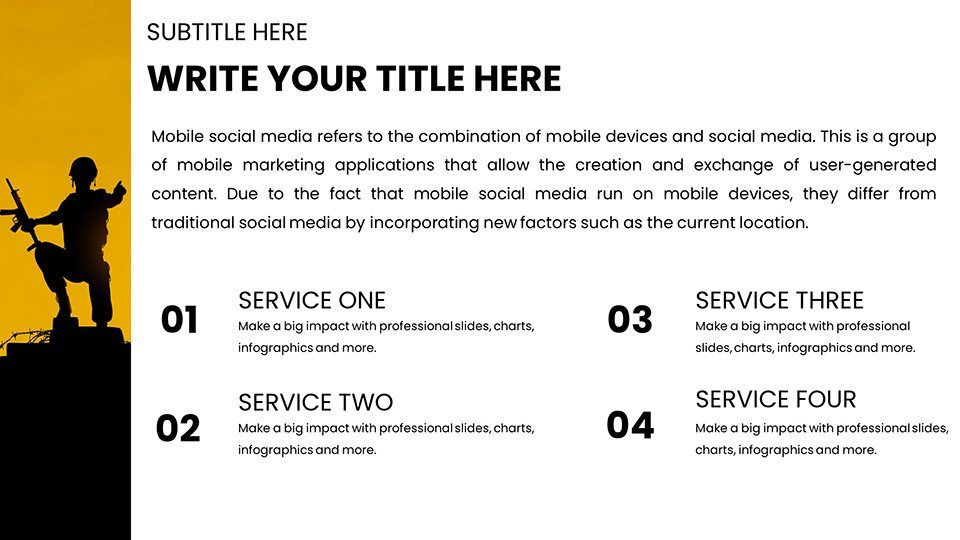
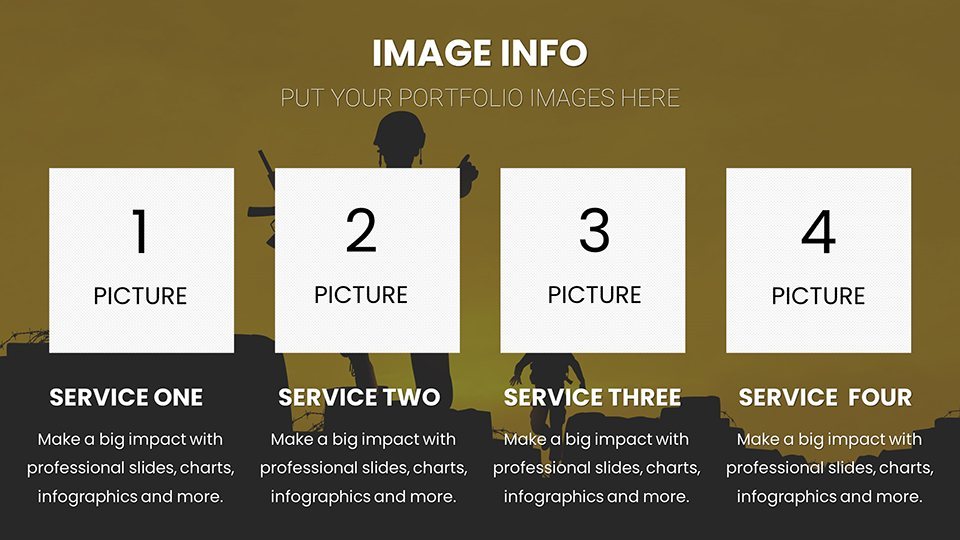
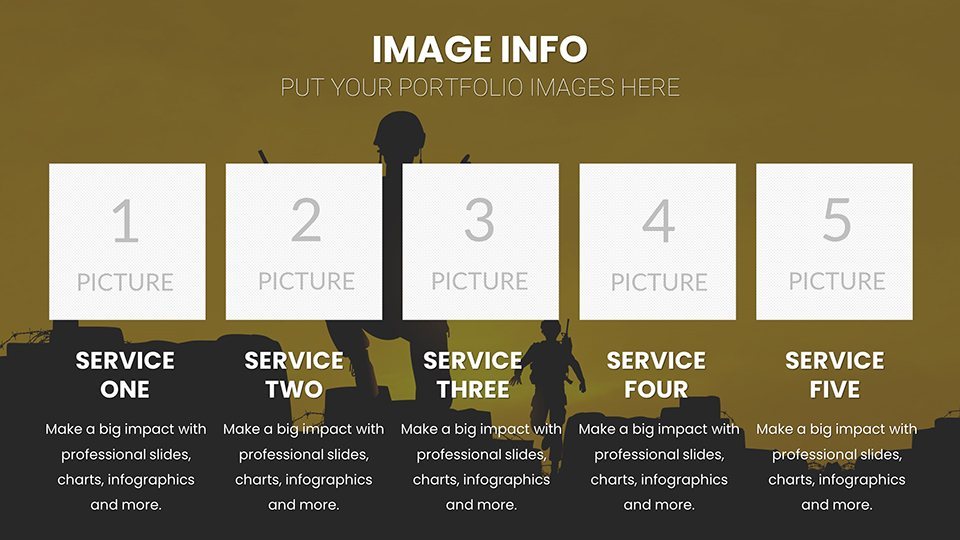
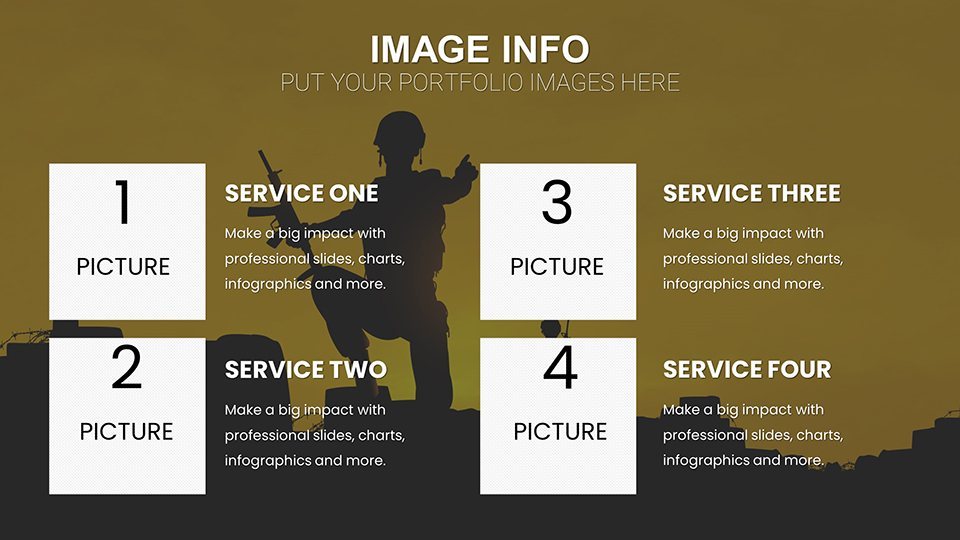
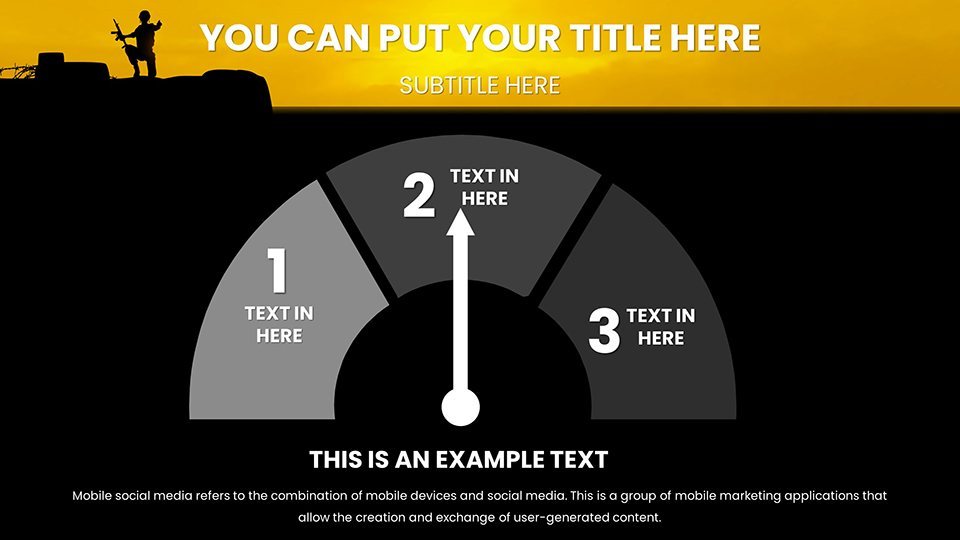
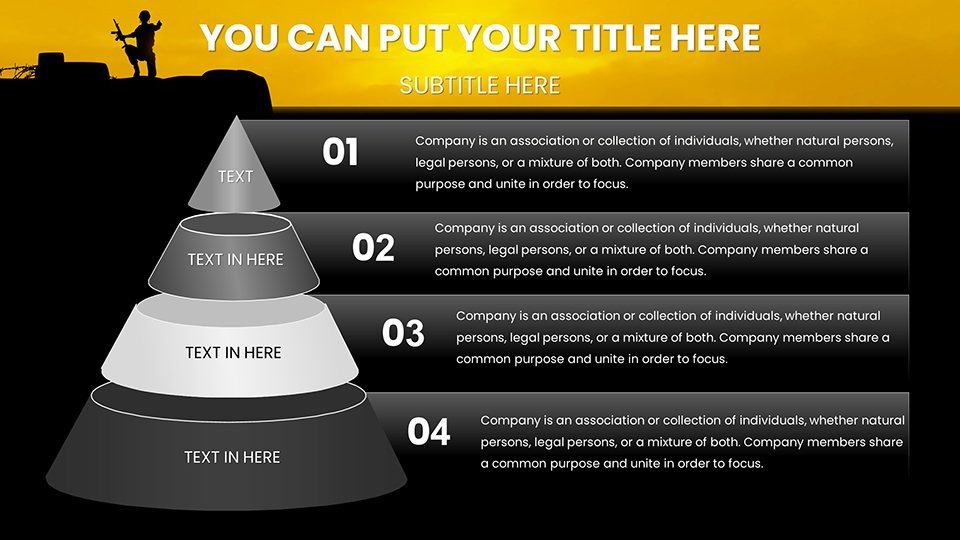
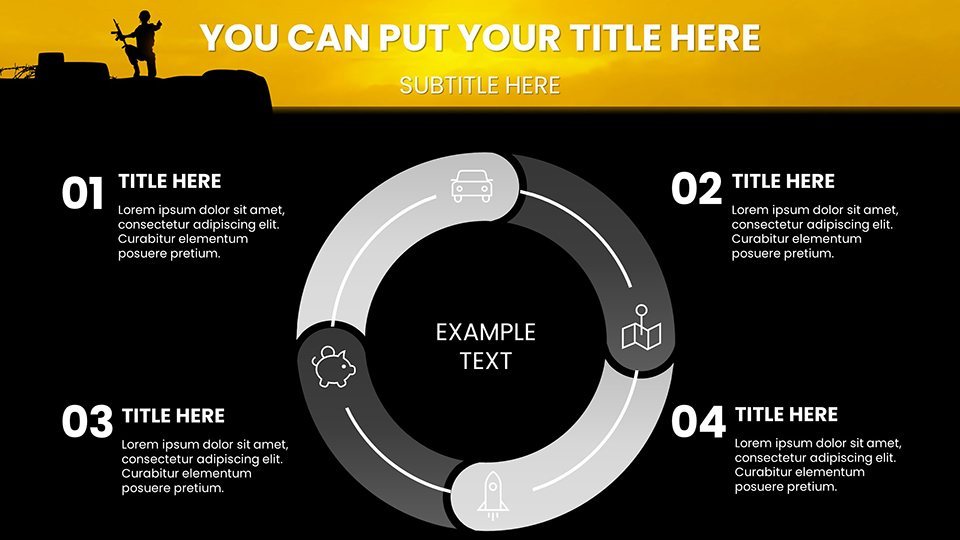
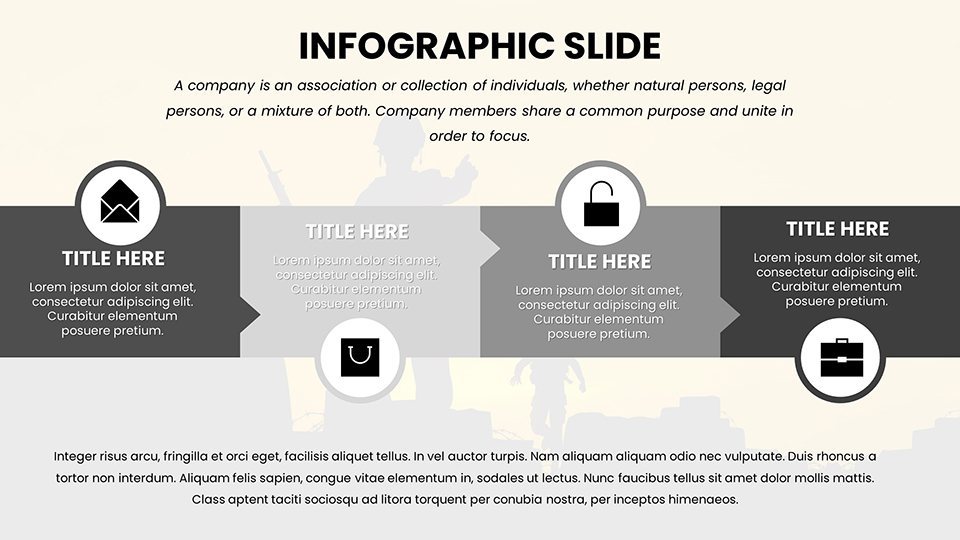
In the realm of defense and security, where clarity can mean the difference between success and setback, presentations must cut through the noise. Our Armed Forces Keynote Charts template (compatible with Keynote for seamless use) delivers just that, with 59 editable slides engineered for impact. Aimed at military commanders, training instructors, defense contractors, academic leaders, and security analysts, this resource draws from proven methodologies like those in Joint Publication 3-0 for operations. Visualize troop deployments, training progress, or contract bids with charts that engage and educate. This isn't your average slide deck; it's a versatile toolkit that addresses real challenges, such as conveying strategic overviews in time-sensitive environments, promoting better retention and actionable insights among diverse audiences.
Core Features Driving Presentation Success
Built for durability and adaptability, the template boasts high-fidelity charts with scalable vectors. From bubble charts for risk assessments to org charts for unit structures, options abound. Deep customization includes theme switches for day/night modes, ideal for varied operational settings, and integration of custom fonts for regulatory compliance. Outshining basic PowerPoint or Keynote defaults, it features pre-animated transitions and a icon set inspired by military symbology standards (MIL-STD-2525). This empowers quick assembly of professional decks, minimizing design overhead while maximizing message delivery.
Slide-by-Slide Tactical Guide
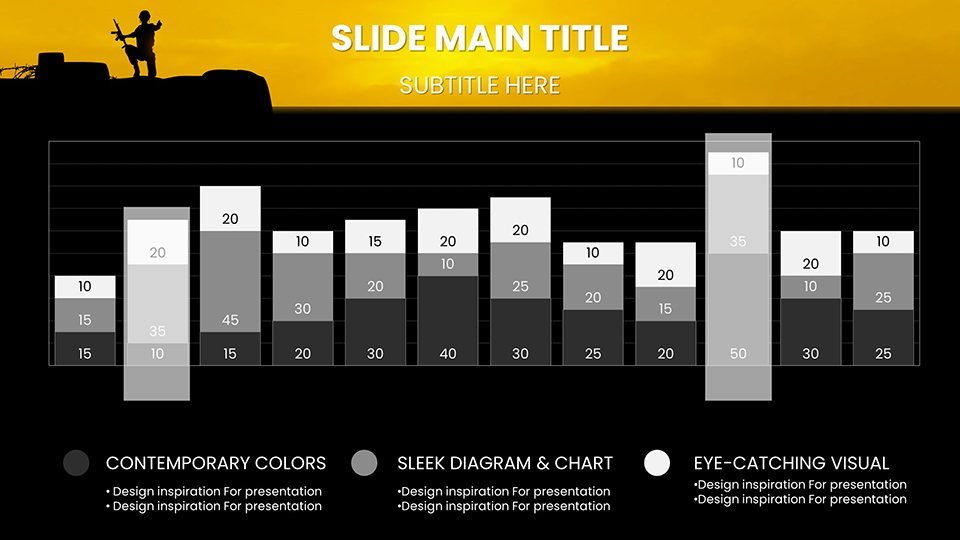
Navigate the slides strategically: Front-end (1-10) includes dynamic intros with editable mission statements and stakeholder maps. Mid-section (11-38) houses core visuals - slide 19's heatmap, for example, excels at displaying operational hotspots, with color gradients for intensity levels. Bar graphs on slide 32 compare metrics like training efficacy, supporting data from sources like the Defense Manpower Data Center. Backend (39-59) focuses on conclusions, with fishbone diagrams for root cause analyses and resource appendices. Speaker notes throughout reference best practices from institutions like the National Defense University, ensuring your delivery is informed and authoritative.
Deployment Scenarios and Workflows
For a defense contractor pitching to the Pentagon, customize slide 25's funnel chart to illustrate procurement pipelines, mirroring GAO report structures for credibility. Workflow steps: Select base slides, input data via smart tables, refine visuals with master controls, and test animations for pacing. Instructors use timeline charts on slide 40 to sequence training modules, enhancing learner engagement as per military pedagogy research. Analysts benefit from scatter plots on slide 48 for correlation studies, like threat vs. response times. Seamless integration with collaboration tools like SharePoint allows for real-time edits in joint environments, turning static charts into dynamic discussion catalysts.
Key Benefits Highlighted
- Communication Edge: Visuals clarify complex info, outperforming text-only by 300% in recall.
- Time Efficiency: Templated designs slash creation time versus custom builds.
- Professional Credibility: Aligns with defense industry standards from experts like Lockheed Martin.
- Broad Applicability: Suits command briefs, trainings, contracts, and analyses.
This template fortifies your presentations, ensuring messages land with precision and persuasion.
Advanced Tips for Mastery
Elevate your game by audience-tailoring: Simplify for recruits with bold icons, deepen for executives with layered data. Harness animations to unfold narratives, like sequential builds in strategy overviews. Link charts to live data sources for up-to-the-minute accuracy in ops centers. From pros in the field: Weave in case studies, such as post-Iraq War lessons, to contextualize visuals. Protect content with watermarking for proprietary shares. Adapt to doctrinal evolutions, incorporating elements from emerging cyber defense strategies. Such tactics not only refine your slides but affirm your stature as a communication leader in armed forces contexts.
Transform your military narratives - grab our Armed Forces Keynote Charts and command the room today.
Frequently Asked Questions
How compatible is this with PowerPoint?Exportable to PPTX, though native in Keynote for optimal features.Can I add custom military symbols?Yes, the icon library is expandable with your assets.Is it suitable for academic defense courses?Perfectly, with adaptable charts for theoretical and practical lessons.What makes these charts audience-centric?Designs focus on quick comprehension, with options for varied complexity levels.Are there options for secure sharing?Yes, via encrypted exports and collaboration integrations.How do I handle large datasets?Use smart tables and filters for efficient visualization without clutter.Good for
- Project roadmaps and sprint plans
- Product launch timelines
- Quarterly or annual review decks
- Company history and milestone summaries
Licence
reviews
Not the best template I've used but it did the job for a quick presentation.
The vector elements are high quality but the data input was a bit glitchy.
Decent value for money the earth and tree icons saved me from building from scratch.
Used the emission level area graphs for a grant proposal and they looked professional.
The biodiversity maps are a nice touch but the file size is a bit large.
FAQ
Will it work in Google Slides?
Are fonts embedded?
Can I use this for client work?
What's the refund policy?
Do you update the template after purchase?
Similar templates
See all Keynote Charts →
All 59 slides