 Click to zoom
Analytical PowerPoint Charts - Instant Download
| Format | .pptx |
| Slides | 19 unique layouts |
| Aspect ratio | 16:9 |
| Compatibility | PowerPoint |
| Animated | No |
| Language | English |
| License | Commercial |
| File size | — |
| Version | v1.0 |
| Last updated | March 2026 |
What's inside
19 Editable Slides Across Graph Types: Package Contents
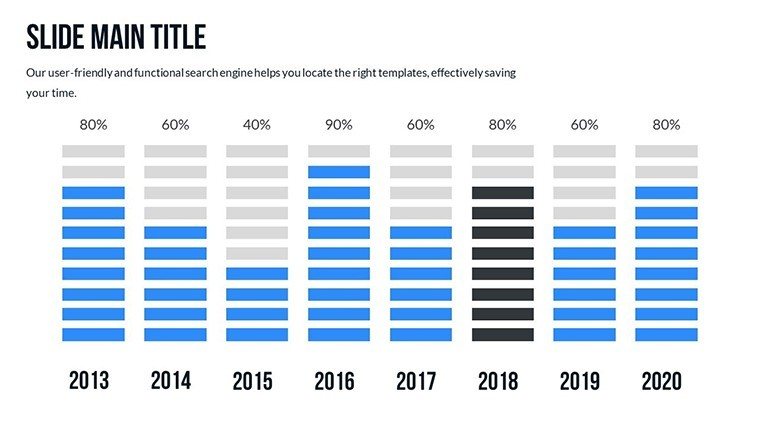
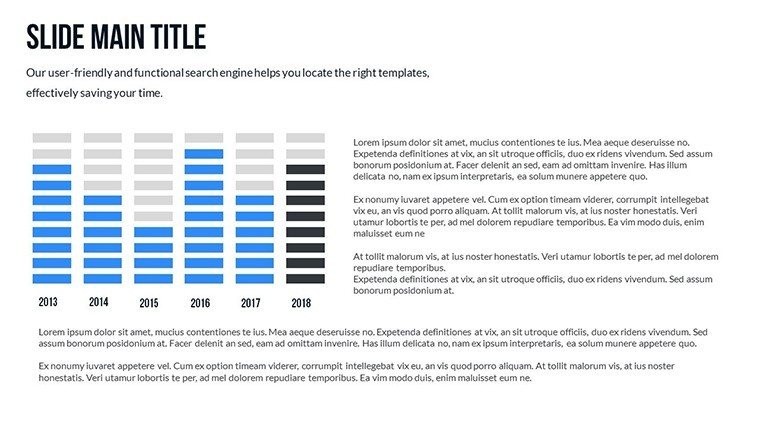
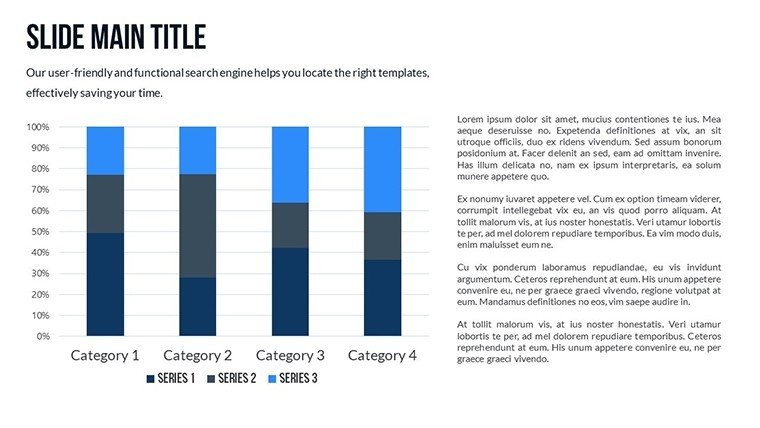
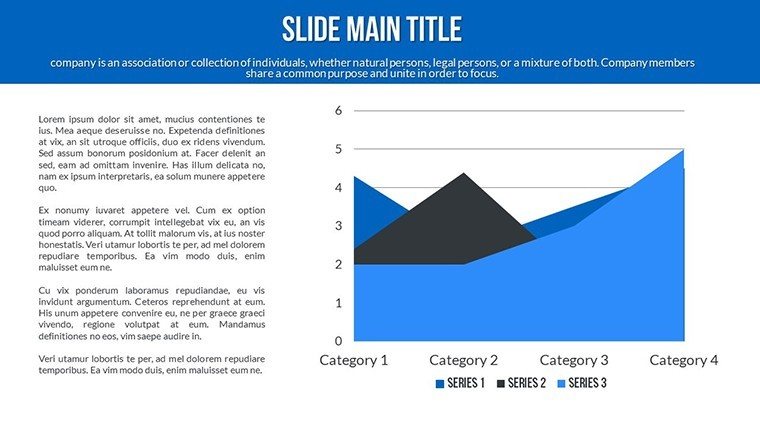
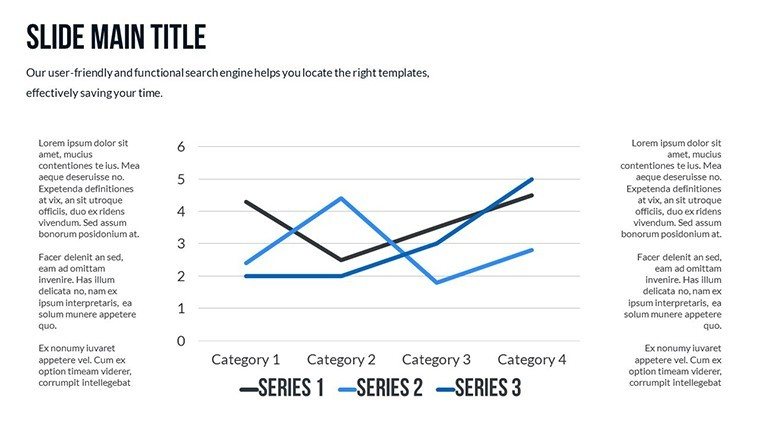
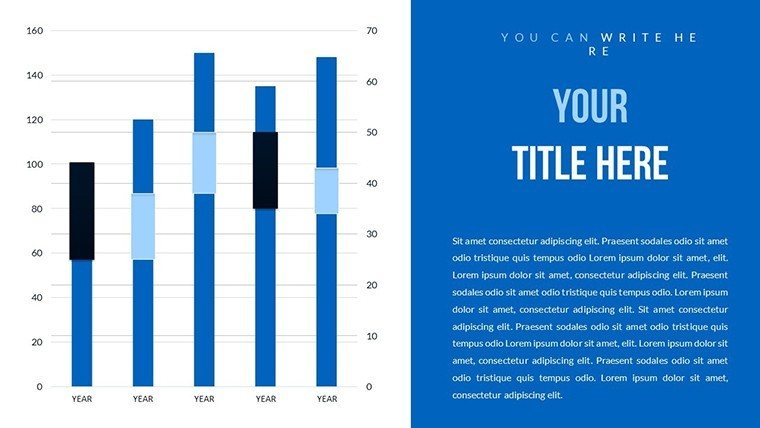
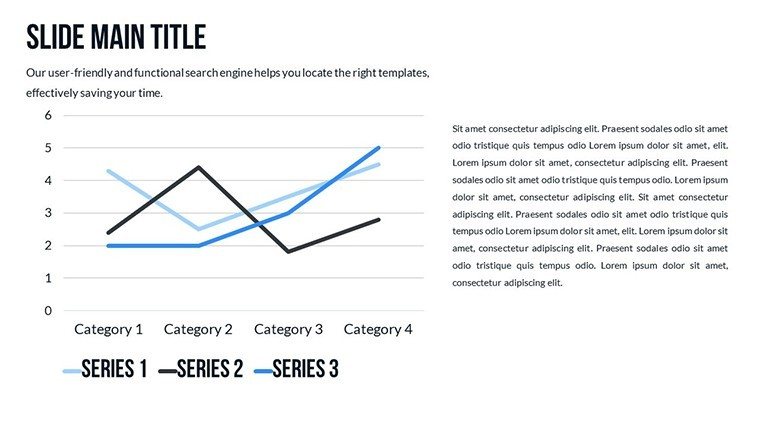
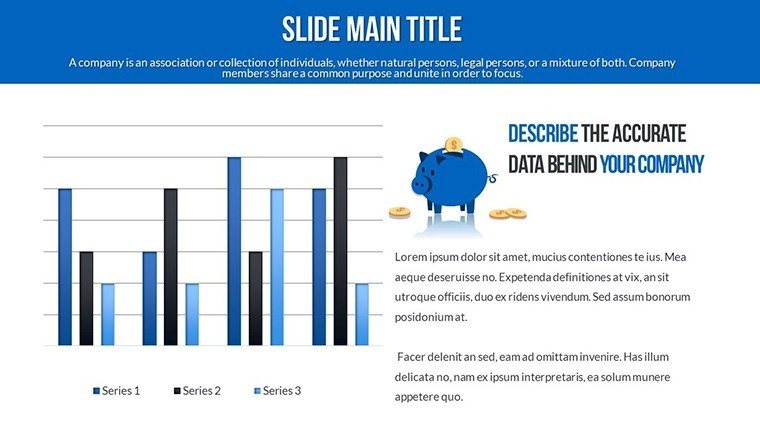
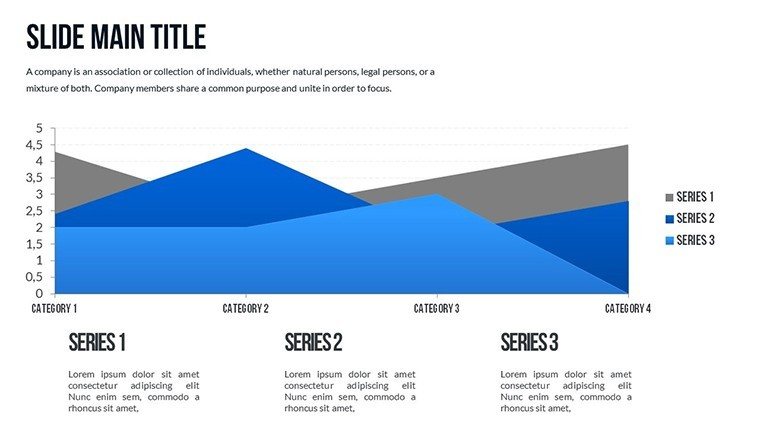
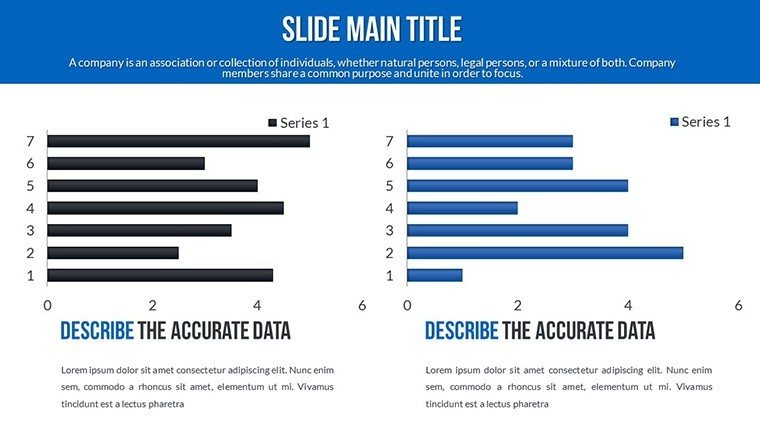
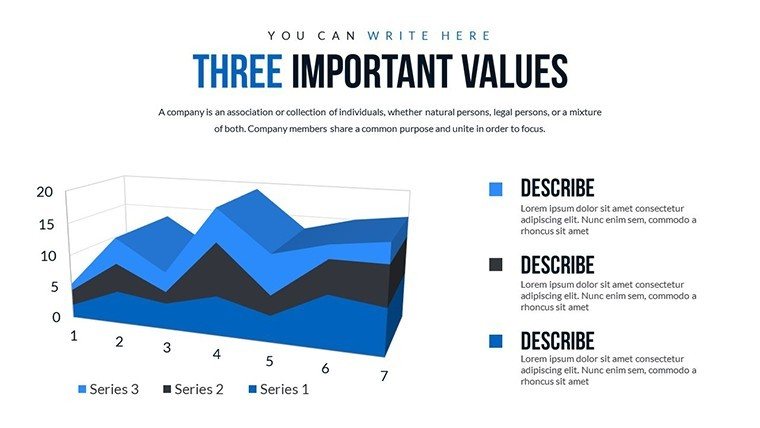
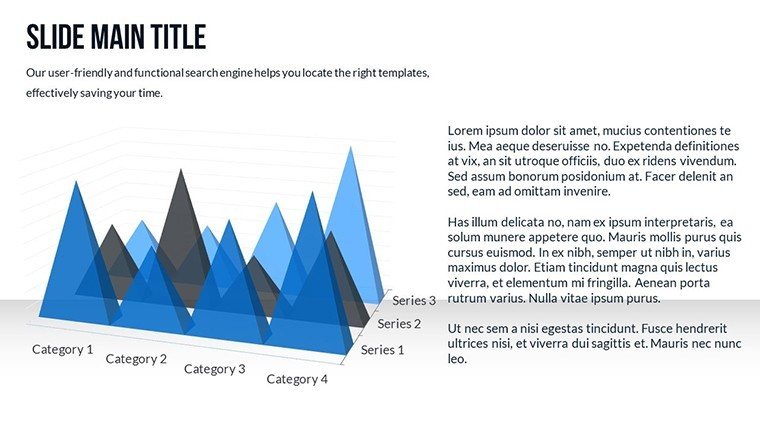
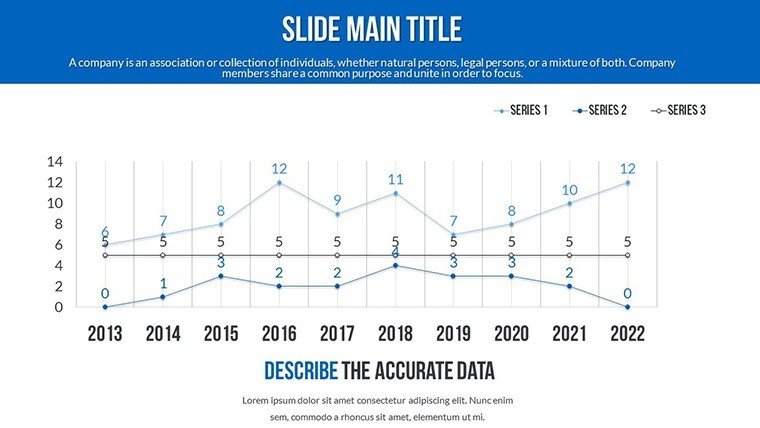
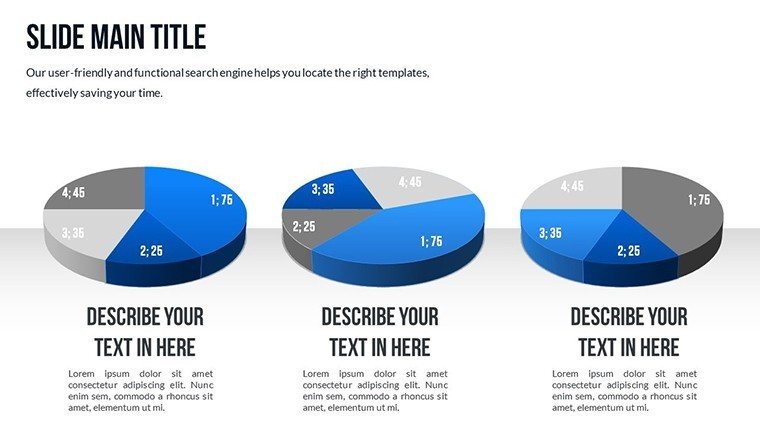
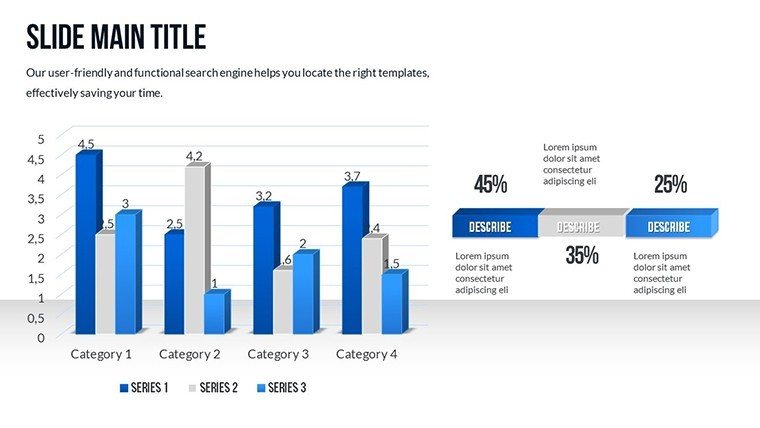
19 editable slides include bar graphs for comparison. Pie charts show distribution. Line charts track trends. Scatter plots reveal correlations. Area charts display cumulative data.
These elements work together to support market analysis by allowing quick data entry across views. The set focuses on area charts for cumulative trends unlike single-chart layouts.
This one works best for market trend dissection in boardrooms because the 19 slides enable rapid adaptation of clean line visuals. The purchase covers the full 19 editable slides.
File format is PPTX. Vector elements keep layouts intact. Subtle animations appear on select graphs. Color contrast highlights key zones.
Business analysts often pair these diagrams with a analysis chart templates when preparing performance reviews.
At a Glance
FeatureDetailsSlides included19 charts covering bar pie line scatter and areaEditable shapessegments resize and recolor independentlyText placeholderslabels update without unlocking groupsColor theme adjustmentscompatible with slide master paletteDiagram connectorsarrows adjustable in direction and weightPowerPoint compatibility2016 2019 365 on Windows and Mac plus Google SlidesAdapting the Template to Your Brand
1. Open the .pptx file in PowerPoint (1 minute).
2. Replace placeholder text with your content (3 minutes).
3. Apply brand colors through the master slide palette (2 minutes).
4. Adjust chart data or diagram labels (4 minutes).
5. Export as PPTX or PDF (1 minute).
Editing difficulty is moderate. The workflow matches PPTX behavior in current versions.
Typical Use Cases by Role
A business analyst in the tech sector dissecting market trends cut report preparation from 3 hours to 45 minutes by updating area charts.
An educator in university statistics courses reused the file across five lectures by swapping color schemes on scatter plots.
These results stem from the intuitive data entry and clean lines.
Download the analytical PowerPoint charts now
Building From Scratch vs. Starting Here
Creating similar graphs manually requires three hours and advanced skill. Clean lines with subtle animations appear on bar graphs. Many presentations clutter layouts with overlapping elements. This layout keeps information spacing balanced for projection screens.
You avoid common mistakes in flow direction. The single purchase covers the complete 19 editable slides.
Get the template and start analyzing
Which PowerPoint versions does this template support?The template opens in PowerPoint 2016 2019 and 365 on both Windows and Mac. It also works with Google Slides. Open the PPTX file in your version first. Update any missing fonts through the slide master to ensure full compatibility.
How do I change the color scheme?Open the file and navigate to the slide master view. Select the theme colors palette. Replace the existing colors with your brand palette. The changes apply automatically to all 19 charts. Save the file and exit master view.
What does the license allow for client work?The license permits use in internal reports and paid client presentations. You may not resell the file or sublicense it. Attribution is not required. Contact support for any custom license questions.
What is the difference between free and paid versions?The page shows only the paid version with 19 slides. No free tier is specified. The single purchase covers all diagram types. No additional files come included.
Is animation supported?Subtle animations appear on select graphs by default. You can add or remove them in PowerPoint. The animation pane lists each element. Base charts stay fully editable.
Good for
- Project roadmaps and sprint plans
- Product launch timelines
- Quarterly or annual review decks
- Company history and milestone summaries
Licence
reviews
This template made my boring office numbers look slightly less boring.
I appreciated the ready-made graph slides because I was in a rush.
The icons were basic but not distracting.
Easy to swap text and charts around.
Pretty useful for quick reports.
FAQ
Will it work in Google Slides?
Are fonts embedded?
Can I use this for client work?
What's the refund policy?
Do you update the template after purchase?
Similar templates
See all PowerPoint Charts →

All 19 slides