 Click to zoom
Analysis Magnifying Glass PowerPoint Charts Template
| Format | .pptx |
| Slides | 18 unique layouts |
| Aspect ratio | 16:9 |
| Compatibility | PowerPoint |
| Animated | No |
| Language | English |
| License | Commercial |
| File size | — |
| Version | v1.0 |
| Last updated | August 2023 |
What's inside
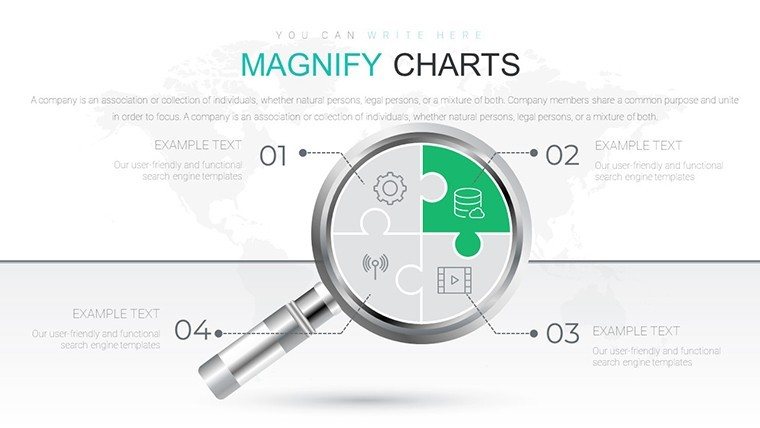
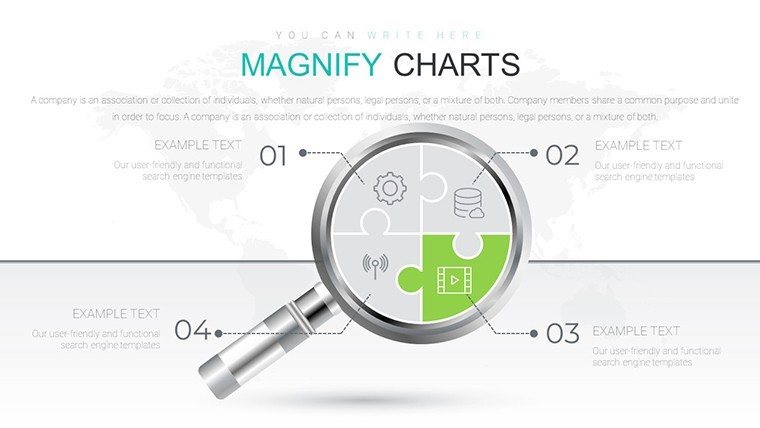
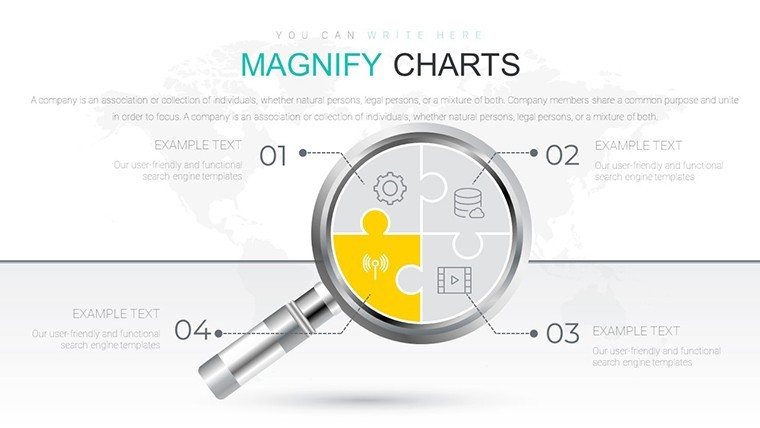
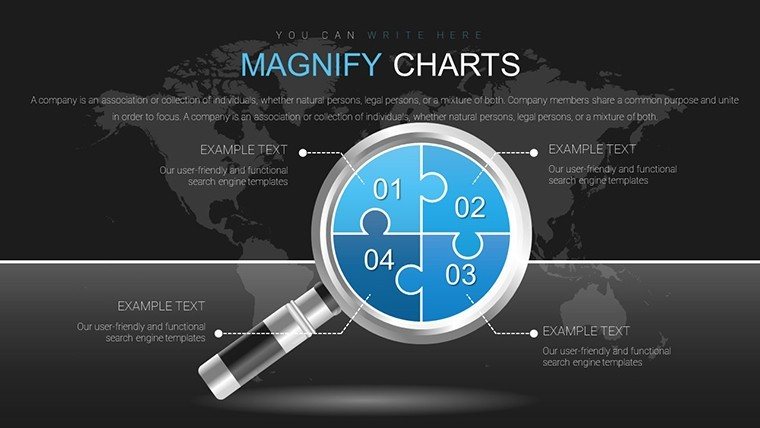
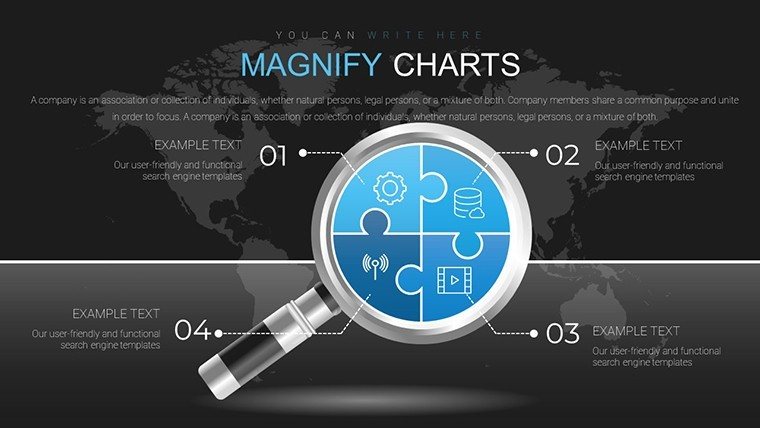
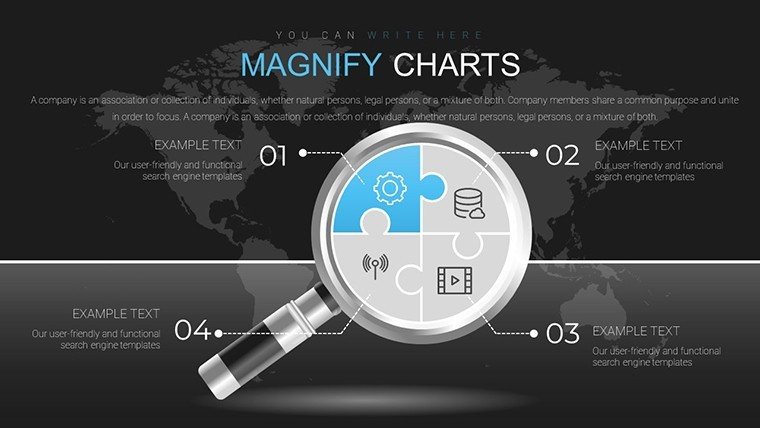
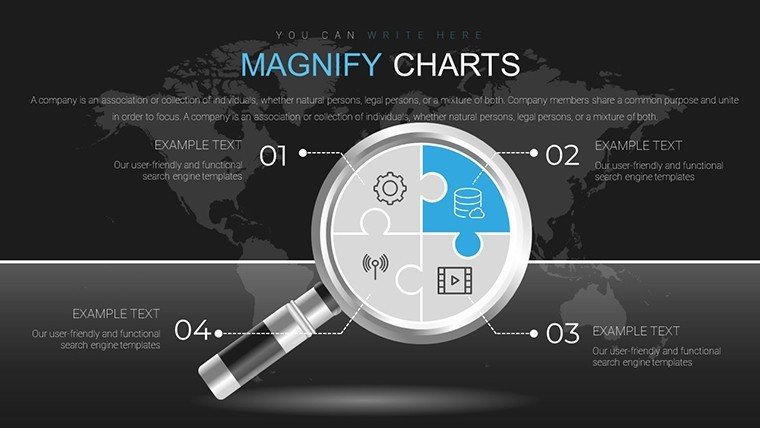
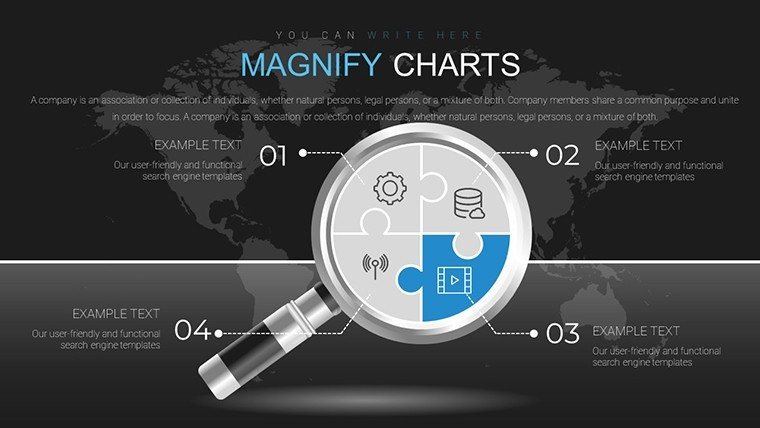
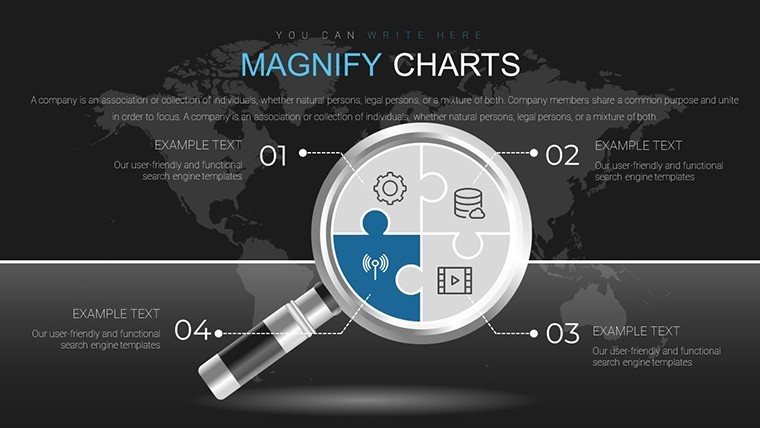
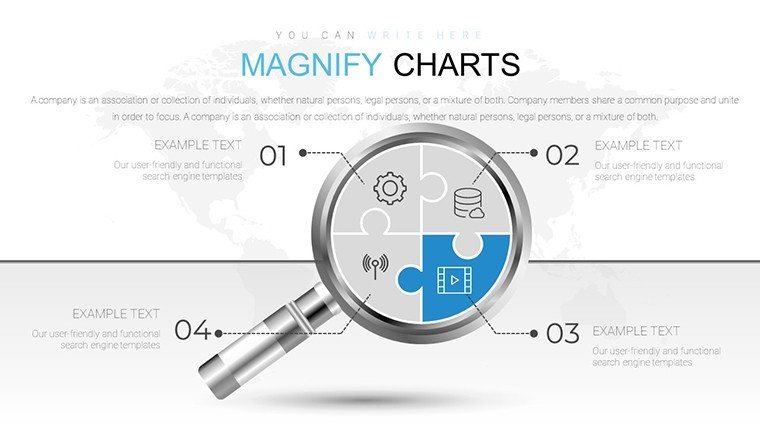
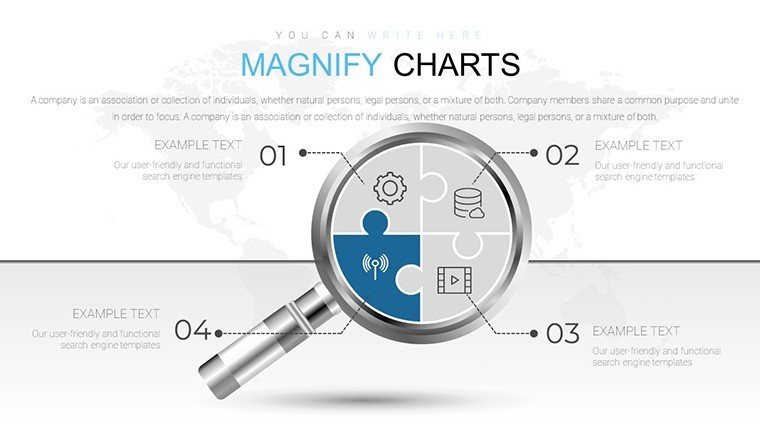
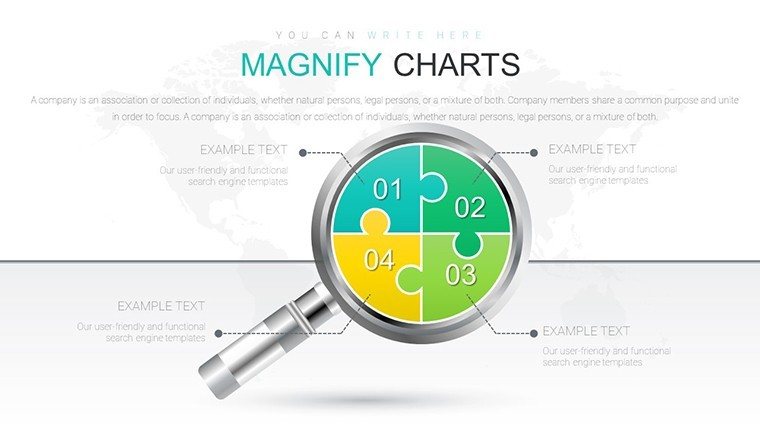
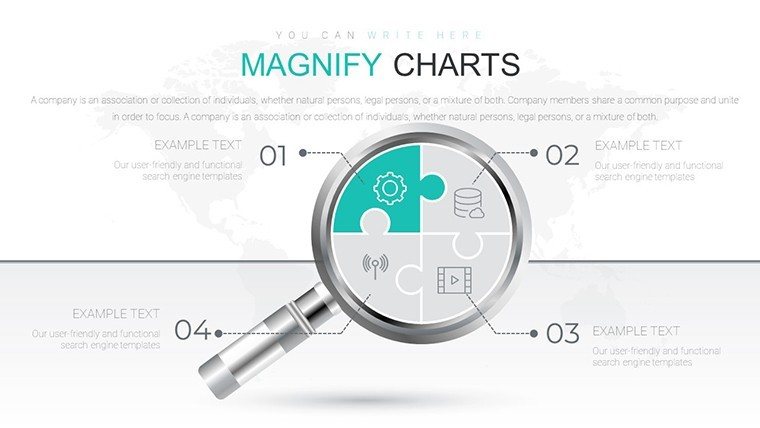
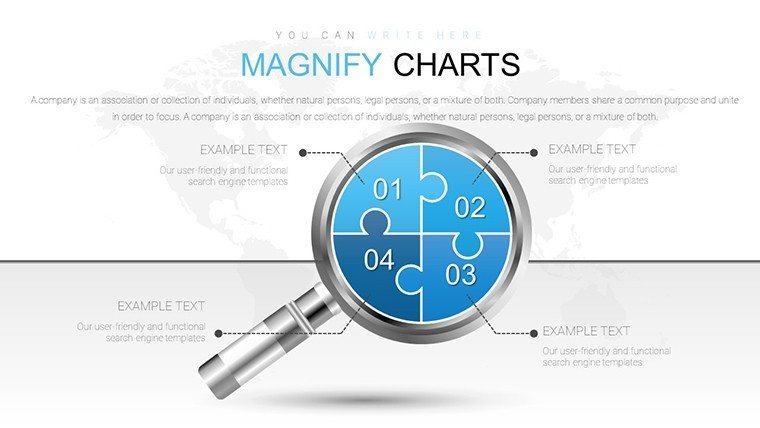
Have you ever needed to spotlight the fine details in your data without losing the big picture? Our Analysis Magnifying Glass PowerPoint Charts Template provides exactly that, with 18 editable slides that use magnifying glass motifs to emphasize key insights. Suited for analysts poring over financial trends or consultants dissecting market puzzles, this template magnifies data points for clearer understanding. Ditch overwhelming spreadsheets; opt for visuals that zoom in on specifics while maintaining context, like highlighting anomalies in a graph. It streamlines complex analyses, saving time and enhancing persuasion in reports or seminars. PowerPoint-ready with animations that 'focus' on elements, it's a precision tool for professionals seeking depth in their presentations. Uncover hidden patterns and present them compellingly, turning data into decisive action.
Focus on Details with Precision Visualization
The magnifying glass symbolizes scrutiny, a concept from investigative methodologies that aids in pattern recognition. This template applies it to charts, allowing users to enlarge segments for emphasis. In finance, zoom into quarterly variances; in marketing, scrutinize consumer segments. Based on principles from 'The Visual Display of Quantitative Information' by Tufte, it avoids distortion while amplifying clarity. The 18 slides cover a range, from overviews to deep dives, all in high-definition for sharp projections.
Key Features for Analytical Excellence
- Magnifying Effects: Interactive zooms on data points, perfect for revealing subtleties.
- Customization Freedom: Tailor colors and layouts to brand specs, ensuring professional cohesion.
- Industry Versatility: Adaptable for puzzles in analysis, from stats to strategies.
- Quick Download: Instant access to .pptx for immediate implementation.
- Animation Integration: Smooth focuses that guide audience attention.
1038 ratings underscore its precision in user experiences.
Use Cases for In-Depth Exploration
Researchers might use it to magnify experimental results, educators to puzzle out concepts. Business pros analyze risks with zoomed views. Echoing methods from McKinsey reports, it facilitates insightful storytelling. Consultants impress with detailed breakdowns.
Slide-by-Slide Insights
Slide 1: Overview with magnifying intro. Slides 2-8: Basic analyses with zoomable graphs. Slides 9-14: Advanced puzzles. Slides 15-18: Summaries and actions.
Strategies for Optimal Use
Identify focal points first. Use neutral palettes for focus. Link data sources. Balance detail with overview.
Advantages Over Standard Tools
Provides targeted emphasis unlike generics. At $20, efficient for pros.
Sharpen your analyses - download this Magnifying Glass Template and reveal the unseen today.
Frequently Asked Questions
How does the magnifying feature work?
It uses animations to zoom on selected data for emphasis.
Can I adjust the zoom levels?
Yes, fully editable for custom focuses.
Suitable for which industries?
Finance, marketing, research, and more.
Format and compatibility?
.pptx, works with PowerPoint 2016+.
Any tutorials?
PowerPoint guides available; support for queries.
Can it handle large datasets?
Yes, with Excel integration for robustness.
Good for
- Project roadmaps and sprint plans
- Product launch timelines
- Quarterly or annual review decks
- Company history and milestone summaries
Licence
reviews
This one was pretty straightforward to edit.
The charts stayed aligned properly.
Some slides felt repetitive but usable.
I liked the summary icons.
Good enough for quick reports.
FAQ
Will it work in Google Slides?
Are fonts embedded?
Can I use this for client work?
What's the refund policy?
Do you update the template after purchase?
Similar templates
See all PowerPoint Charts →
All 18 slides