 Click to zoom
Agile Scrum PowerPoint Charts - Fully Editable | ImagineLayout
| Format | .pptx |
| Slides | 8 unique layouts |
| Aspect ratio | 16:9 |
| Compatibility | PowerPoint |
| Animated | No |
| Language | English |
| License | Commercial |
| File size | — |
| Version | v1.0 |
| Last updated | March 2026 |
What's inside
8 Slides, Base Scheme: What You Get
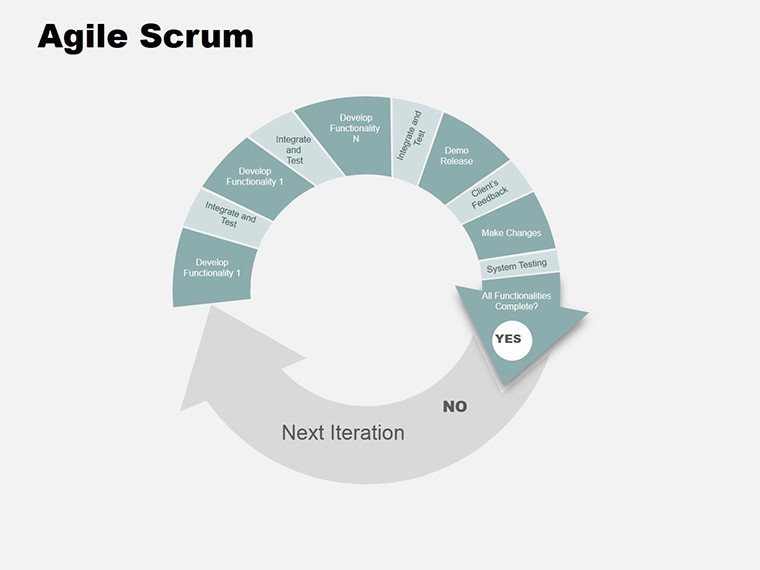
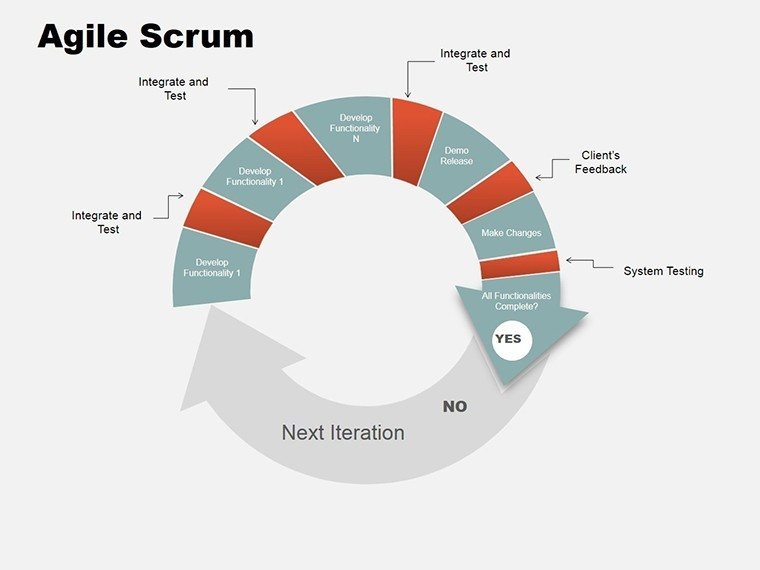
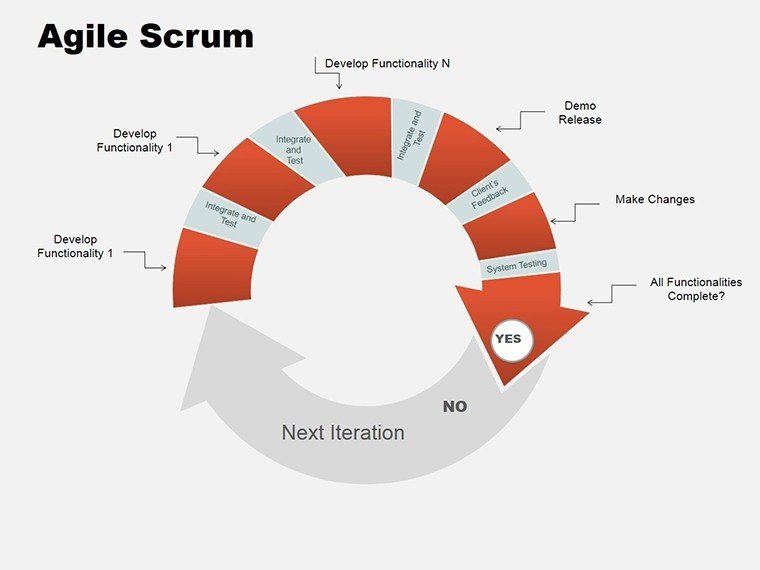
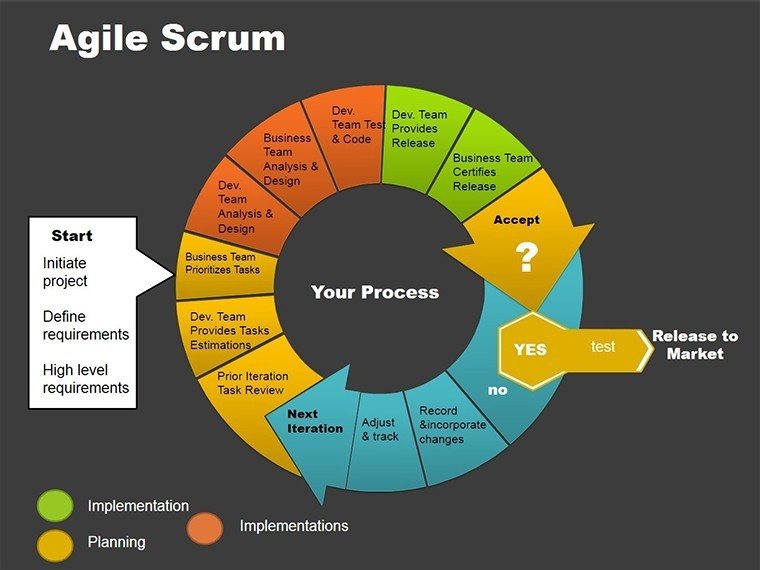
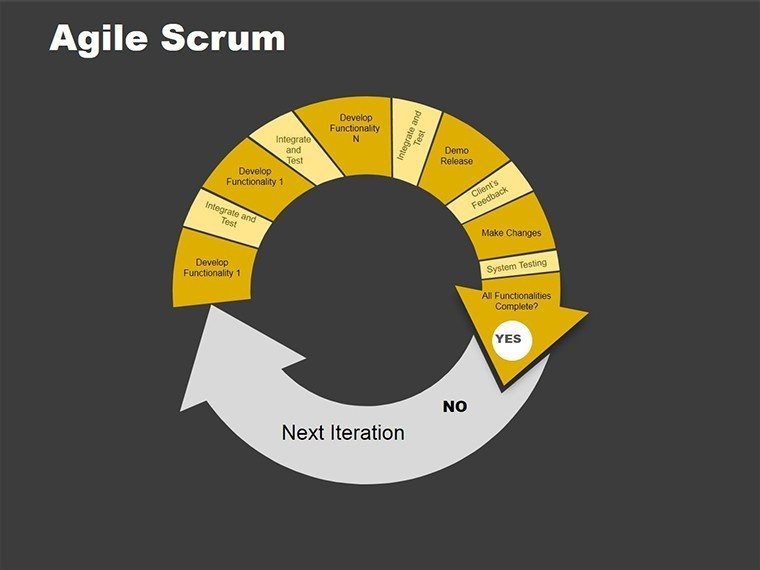
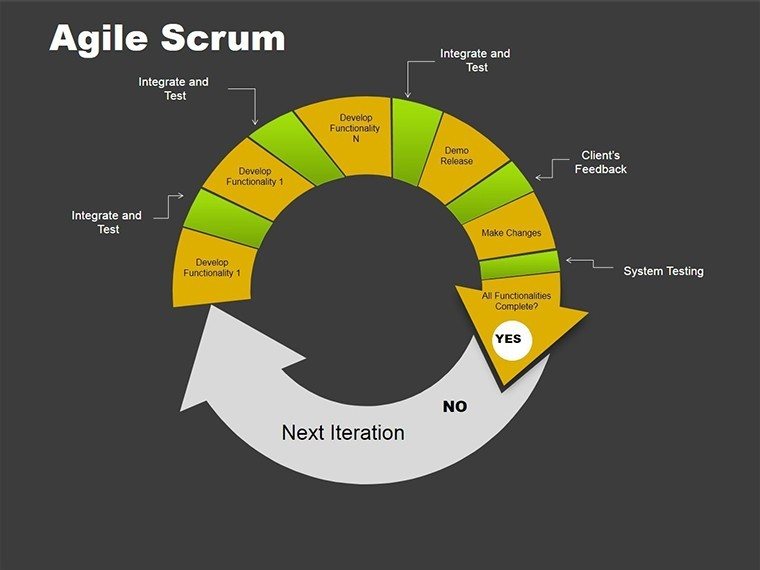
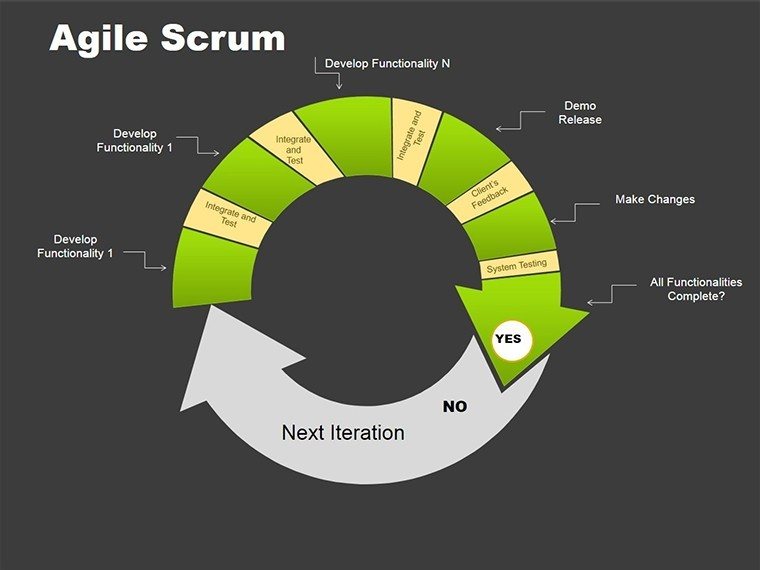
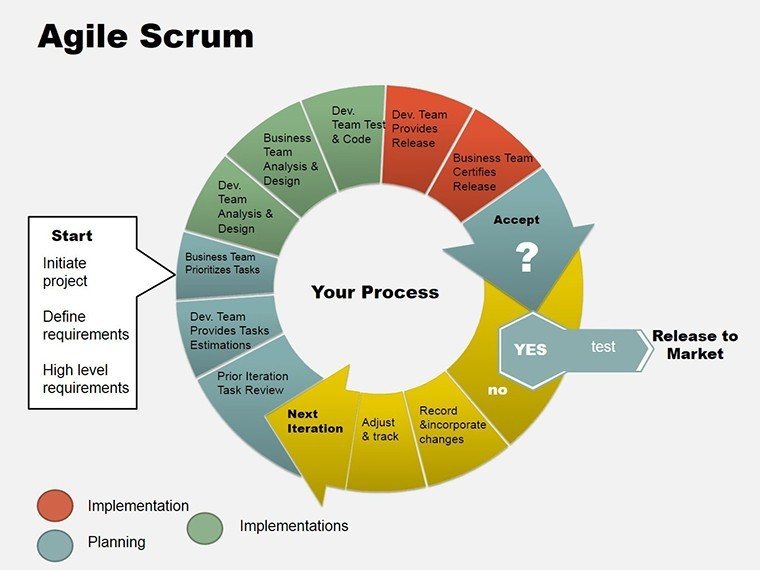
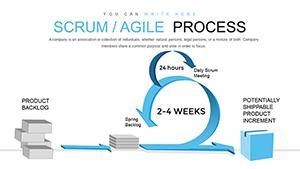
8 slides cover agile scrum cycles in .pptx and .ppt formats.Charts depict sprints and flows, working together for process overviews in training sessions.Unlike linear process maps, these emphasize iterative loops with distinct visual characteristics like curved arrows.
The layouts enable clear communication in project management decks.Each connects stages through diagram connectors, suiting teams that handle iterative updates.Icon layers add context without cluttering the composition.
Format and Compatibility Details
FeatureDetailsSlides included8 with scrum cycle variationsDiagram categoriesSprint cycles, backlog flows, retrospective chartsEditable elementsArrows bend flexibly, stages recolor separately, text resizes automaticallyAspect ratio16:9 for team screensPowerPoint compatibilityFunctions in 2016, 2019, 365, Mac includedColor schemesOne scheme with master adjustments for iterationsFile formats.pptx for editing, .ppt for legacy supportDetails ensure seamless use in development environments. Compatibility covers common setups.
Edit, Brand, Present: The Workflow
Beginner difficulty makes this accessible.
- Open .pptx in PowerPoint (1 minute).
- Update stage text (2 minutes).
- Change colors in slide master (3 minutes).
- Modify arrow directions (4 minutes).
- Export as needed (1 minute).
This aids in agile workshops. It incorporates text placeholders and color contrast.
How Consultants Use This in Client Work
Software engineers in tech startups apply these scrum charts for sprint planning meetings.They outline backlogs and reviews, cutting setup from 1 hour to 20 minutes.The cycles help visualize iterations for non-dev stakeholders.
Trainers in education sectors use them during methodology sessions.Charts adapt to different group sizes by swapping icons, reused over multiple courses.One trainer handled three sessions with minor tweaks.
Download for your agile needs.
The Cost of Not Using a Template
Replicating scrum cycles manually needs 2 hours and moderate skills in curve tools.Typical problems include uneven arrow spacing that breaks layout composition in training decks.Here, pre-built loops save time, with beginner edits for icon layers.
Many cycles place stages in straight lines, but curved arrows here better fit iterative data structures.Consultants link these to scrum process flows for detailed views.Check the cycle PowerPoint charts category for more.
Add methodology overviews as complements.
Acquire the set immediately.
Compatible PowerPoint versions?Works in PowerPoint 2016, 2019, and 365 on Windows or Mac. .pptx ensures modern features. Legacy .ppt opens in older versions with possible arrow shifts. Test import in your app.
How to update color scheme?Enter Slide Master via View menu. Edit theme colors for all cycles. Adjust single arrows in Format. Maintains loop integrity during changes.
What can I do under the license?Allowed for internal training and client sessions with payment. Prohibits resale or file sharing. Alter for repeated use. Include in workshop materials without extra fees.
Differences in free vs paid?No free version provided. Paid grants all 8 slides with complete cycles. Full editing on every stage. Access unrestricted from purchase.
Support for animations?Included for stage builds. Apply via Animations tab. Remove if static preferred. View in slideshow to adjust pacing.
Good for
- Project roadmaps and sprint plans
- Product launch timelines
- Quarterly or annual review decks
- Company history and milestone summaries
Licence
reviews
Had to prepare KPI slides before lunch and this template helped a lot.
The line chart pages were probably my favorite part.
Some elements moved around after editing which was annoying.
Still better than creating charts from scratch.
I used it mostly for internal reports.
FAQ
Will it work in Google Slides?
Are fonts embedded?
Can I use this for client work?
What's the refund policy?
Do you update the template after purchase?
Similar templates
See all PowerPoint Charts →
All 8 slides