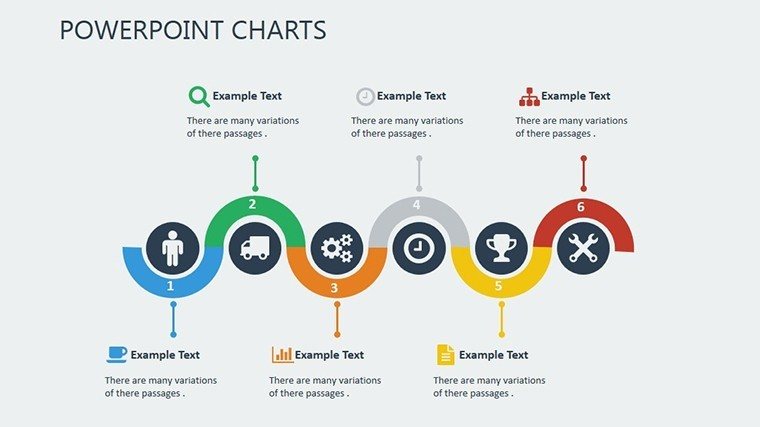
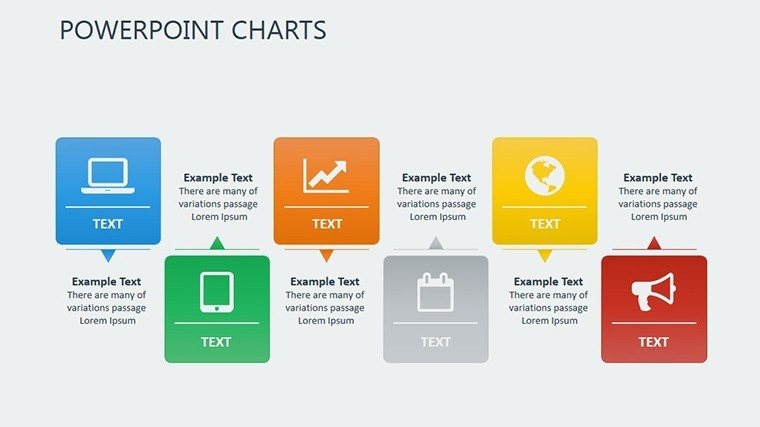
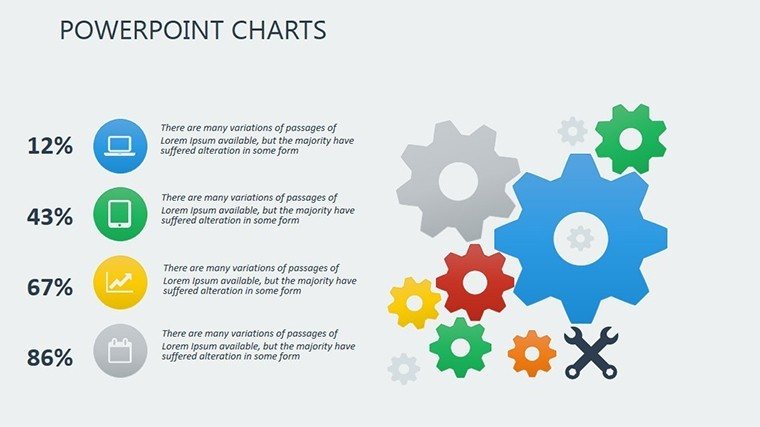
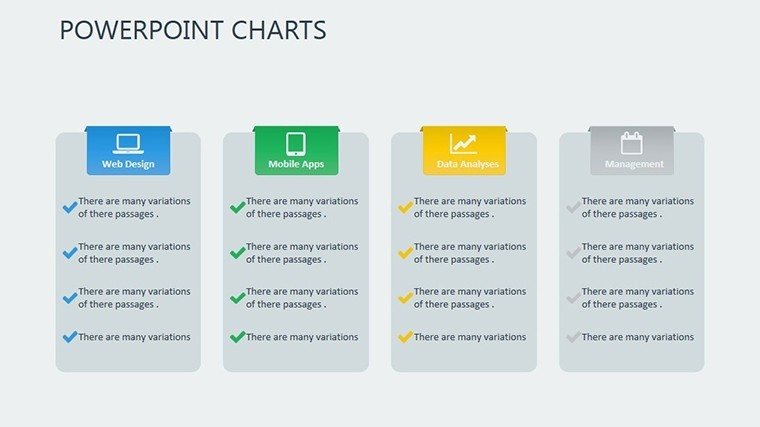
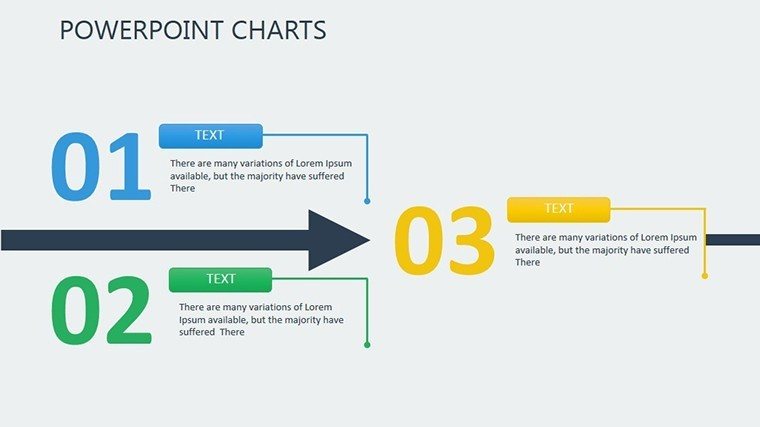
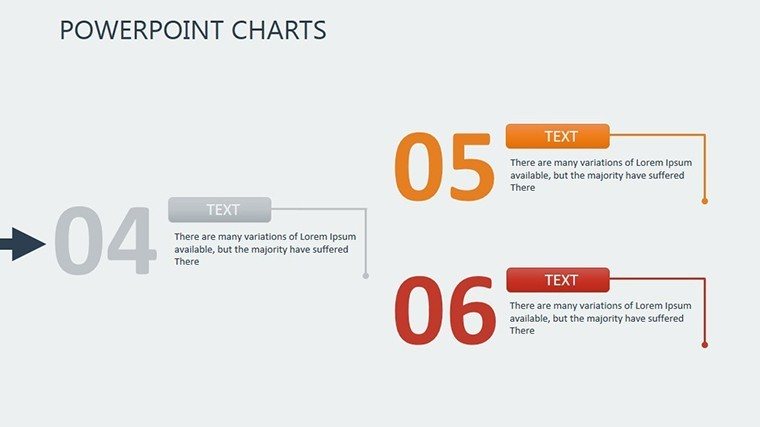
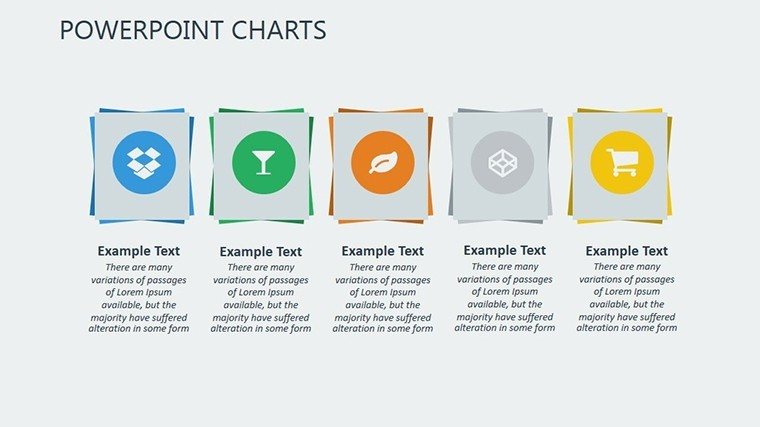
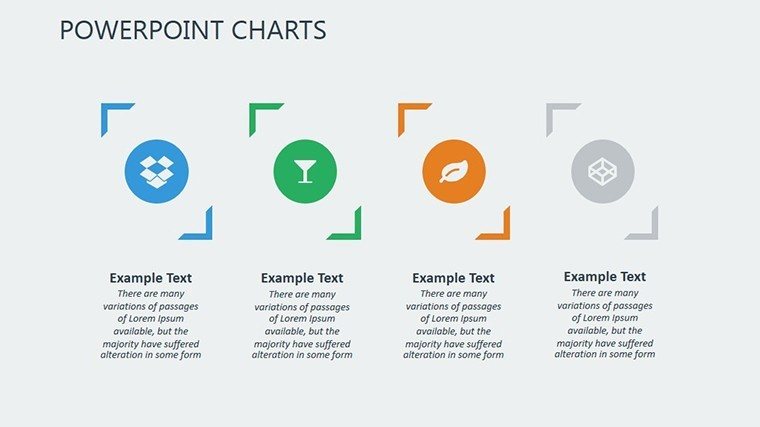
 Click to zoom
Accessory PowerPoint Charts Template: Master Data Visualization with Ease
| Format | .pptx |
| Slides | 14 unique layouts |
| Aspect ratio | 16:9 |
| Compatibility | PowerPoint |
| Animated | No |
| Language | English |
| License | Commercial |
| File size | — |
| Version | v1.0 |
| Last updated | September 2023 |
What's inside
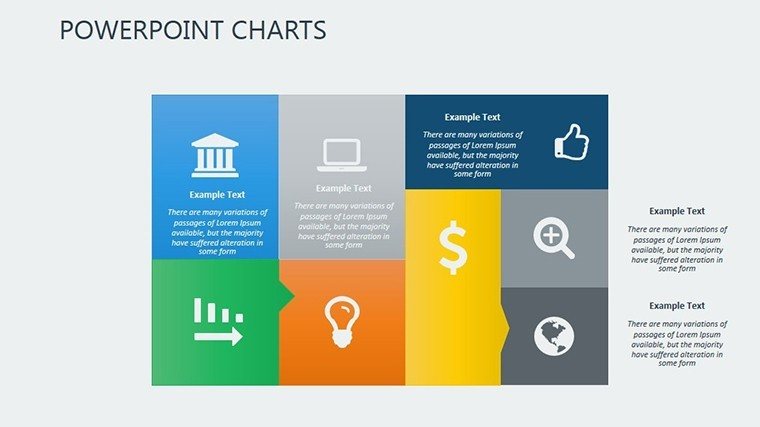
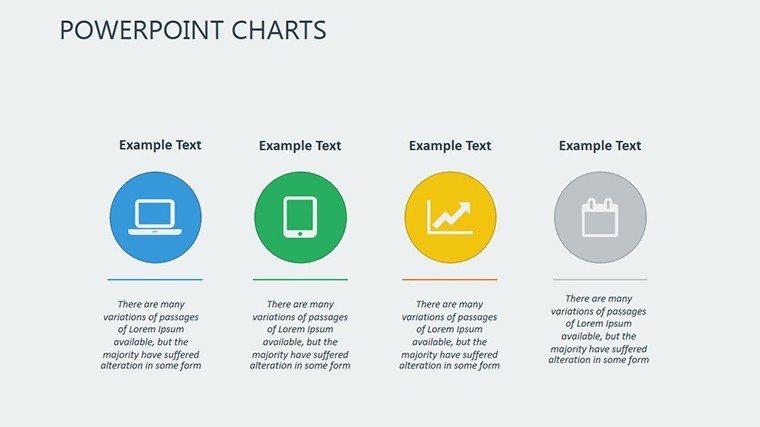
In an era where data drives decisions, presenting information clearly can make or break your message. Our Accessory PowerPoint Charts Template is engineered for business analysts, educators, and managers who demand precision and style in their visuals. Featuring 14 editable slides, this versatile toolkit covers essential chart types like bars for comparisons, pies for proportions, and lines for trends, all wrapped in a professional design that's easy to tweak. Picture effortlessly illustrating quarterly sales growth in a board meeting or breaking down student performance metrics in a faculty review - these charts turn numbers into narratives. Fully compatible with PowerPoint, it integrates seamlessly with your existing decks, adhering to data visualization best practices from experts like Edward Tufte to minimize chartjunk and maximize insight. This template isn't mere decoration; it's an accessory that elevates your presentations, helping you communicate complex datasets with authority and appeal.
Standout Features for Professional Polish
This template excels in its breadth of options, providing a foundation for any data-heavy presentation. Each slide is pre-formatted with gridlines for accuracy, legends for clarity, and axes labels that auto-adjust to your inputs, ensuring error-free visuals.
- Diverse Chart Selection: Bar graphs for categorical data, pie charts for part-to-whole relationships, and line graphs for time-series analysis.
- Customization Depth: Modify colors to align with corporate guidelines, fonts for readability, and styles from flat to 3D for emphasis.
- Data Integration: Link directly to Excel sheets for live updates, ideal for dynamic reports.
- Accessory Elements: Add-ons like callouts, arrows, and icons to annotate insights without overcrowding.
Backed by marketing analytics, such charts can improve comprehension by 50%, as noted in Harvard Business Review articles on visual aids, positioning you as a data-savvy leader.
Targeted Applications in Business and Education
Harness this template for specific needs: In business, use Slide 1 for an executive summary dashboard with combined charts. Slides 2-5 focus on financials - bar charts for revenue streams, pies for expense breakdowns. For project managers, Slides 6-8 track milestones with Gantt-like lines, highlighting delays effectively.
A case in point: A consulting firm utilized accessory charts to visualize client ROI, securing renewals through clear, compelling evidence. Educators can adapt Slides 9-11 for lesson plans, like graphing historical events or scientific data, fostering student engagement. Wrap up with Slides 12-14 as Q&A or summary visuals, incorporating feedback loops.
Integrate with tools like Tableau for advanced data pulls or SharePoint for team sharing. Pro tips: Use consistent scales across charts for fair comparisons, per ANSI standards for graphical excellence, and test on mobile for responsive design.
Workflow for Crafting Compelling Charts
- Import your dataset into the template's embedded spreadsheet.
- Select chart type from the 'Insert' menu and populate with data.
- Customize aesthetics using the 'Chart Tools' ribbon for colors and effects.
- Add annotations via shapes to highlight key trends.
- Rehearse transitions to ensure smooth narrative flow.
This methodical approach outpaces basic PowerPoint by offering pre-optimized layouts, reducing setup time while enhancing professionalism.
Elevating Your Data Game Above the Rest
Unlike generic freebies with limited options, our accessory template provides robust, scalable designs that handle large datasets without lag. It weaves in LSI like 'data dashboards' fluidly, optimizing for searches on visualization tools.
Key values: Accuracy in representations to build trust, efficiency in edits for tight deadlines, and versatility across sectors. Secure, instant downloads underscore reliability, with no subscriptions needed. Combine with BI software for real-time charts, creating dashboards that impress stakeholders like those in Fortune 500 reports.
From an analyst's view, this leads to better decision-making, as visualized data reveals patterns text alone misses. Hypothetical success: A school district improved grant applications with pie charts showing resource allocation, drawing from real ed-tech trends.
Insider Advice for Data Mastery
Choose chart types wisely - avoid pies for more than five segments to prevent misinterpretation. Incorporate error bars for statistical rigor, aligning with APA guidelines. For , source data from reputable outlets like World Bank, crediting in footnotes.
Enhance with conditional formatting for thresholds, or embed macros for interactive filters. This template is your secret weapon for data-driven storytelling. Time to accessorize your slides? Download the Accessory PowerPoint Charts Template and visualize victory.
Frequently Asked Questions
What chart types are included?
The template features bar, pie, line graphs, and more, all editable for your data needs.
Can I link external data sources?
Yes, integrate with Excel or other spreadsheets for automatic updates.
Is it compatible with older PowerPoint versions?
Works with PowerPoint 2010 and newer, with full features in recent editions.
How do I handle large datasets?
Charts support extensive data; use filtering options to focus on key subsets.
Are there animation options for charts?
Built-in animations allow elements to appear sequentially for dramatic reveals.
Good for
- Project roadmaps and sprint plans
- Product launch timelines
- Quarterly or annual review decks
- Company history and milestone summaries
Licence
reviews
I liked the spacing between sections.
Needed a quick analytics presentation and this worked.
The graphs looked organized even after adding more data.
Some slides were too colorful for my taste.
FAQ
Will it work in Google Slides?
Are fonts embedded?
Can I use this for client work?
What's the refund policy?
Do you update the template after purchase?
Similar templates
See all PowerPoint Charts →
All 14 slides