 Click to zoom
7 Market Phases PowerPoint Charts Template: Navigate Financial Cycles with Confidence
| Format | .pptx |
| Slides | 20 unique layouts |
| Aspect ratio | 16:9 |
| Compatibility | PowerPoint |
| Animated | No |
| Language | English |
| License | Commercial |
| File size | — |
| Version | v1.0 |
| Last updated | June 2024 |
What's inside
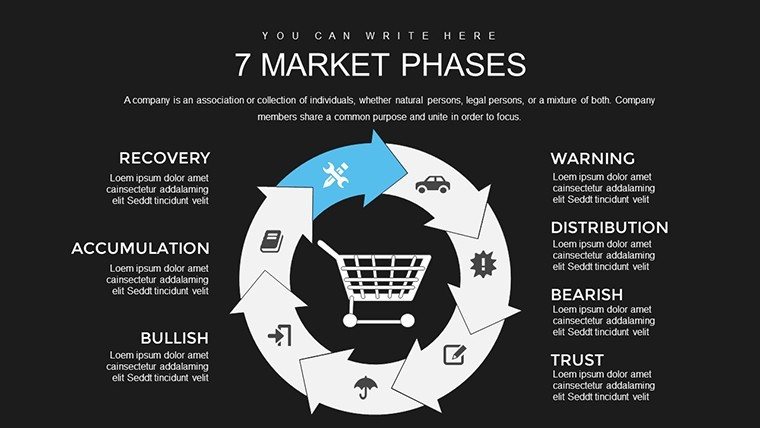
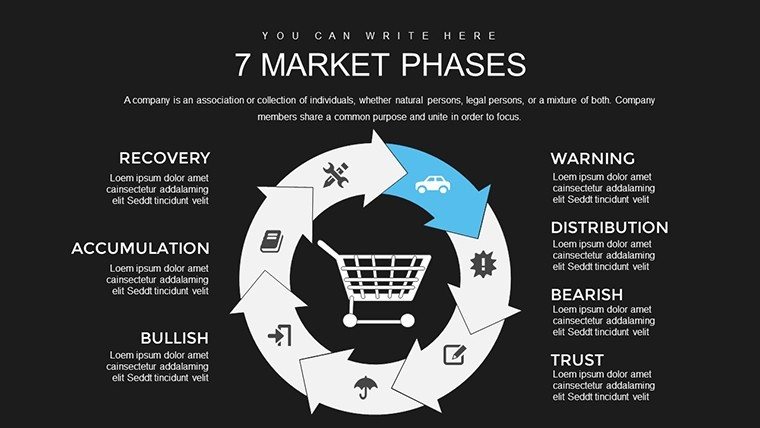
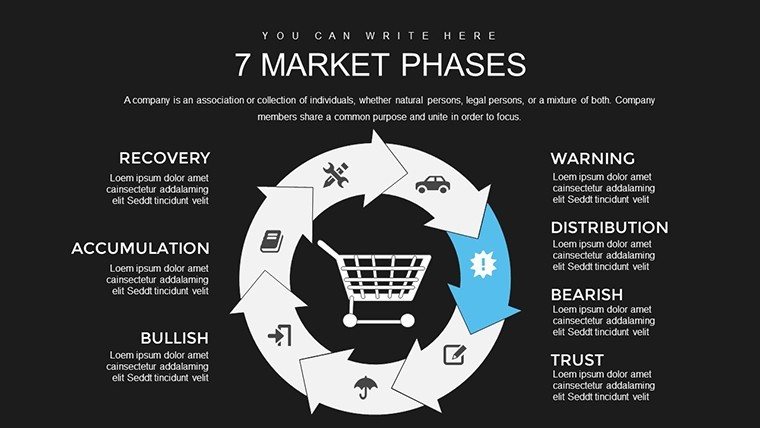
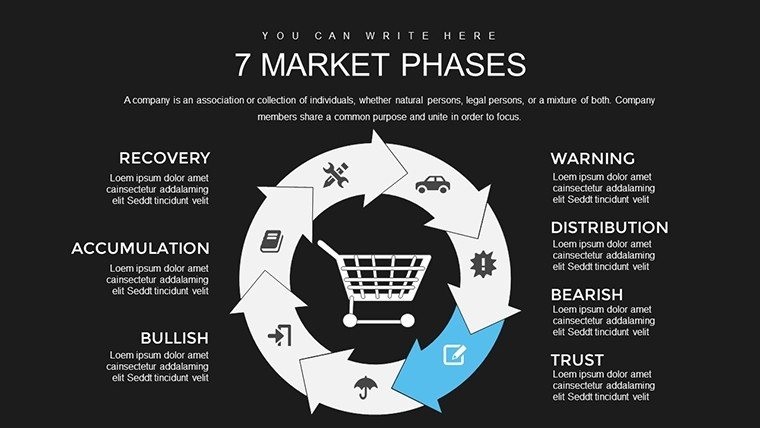
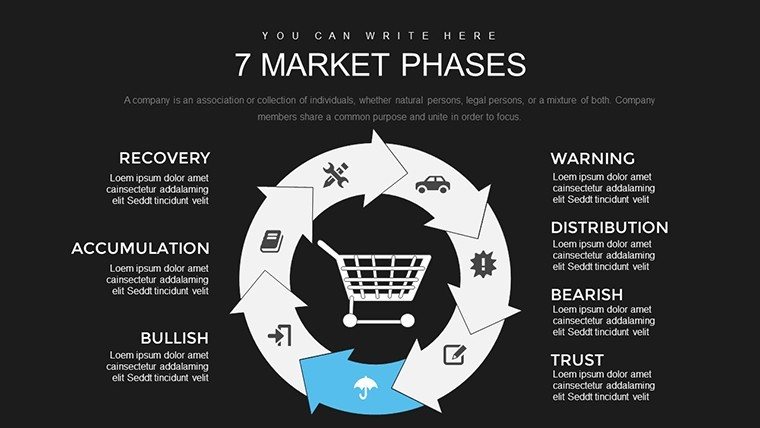
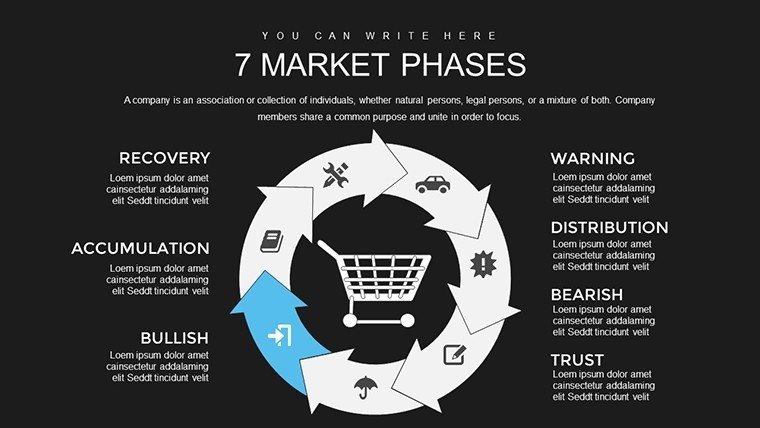
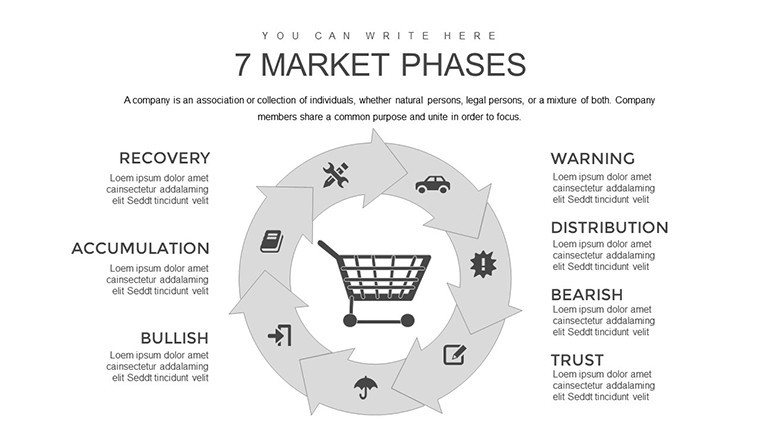
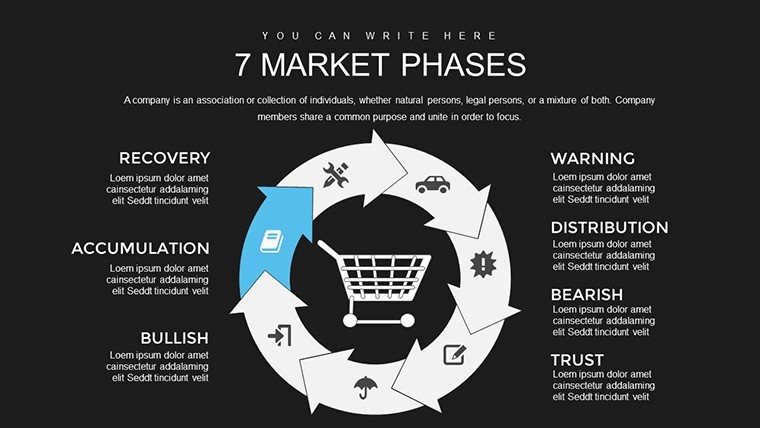
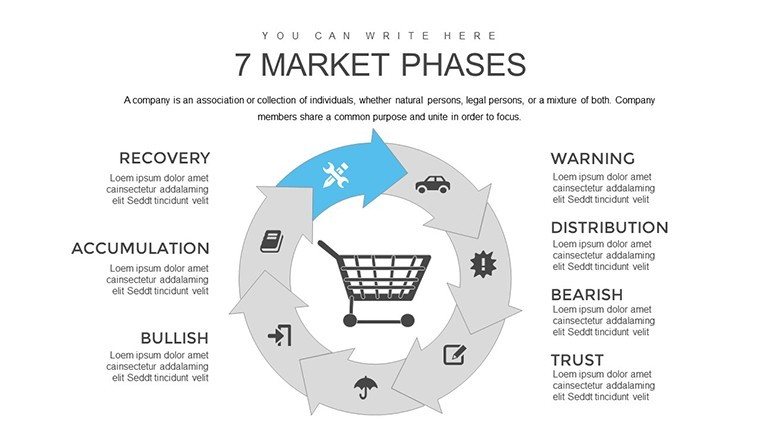
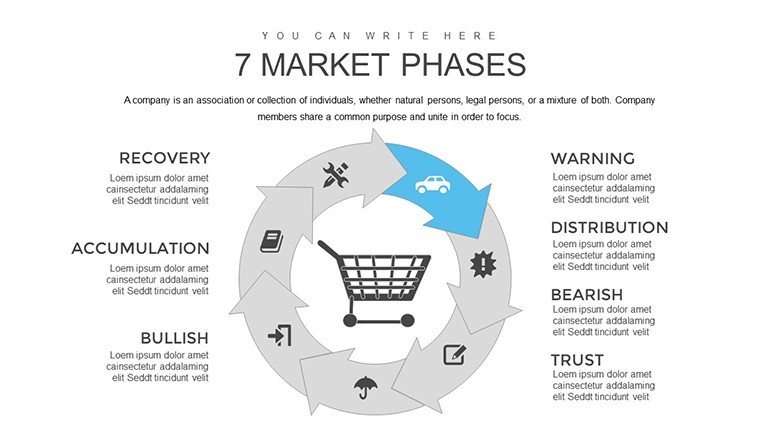
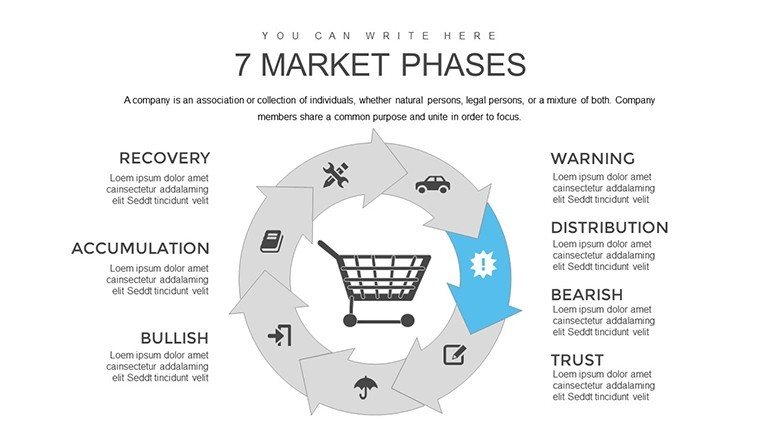
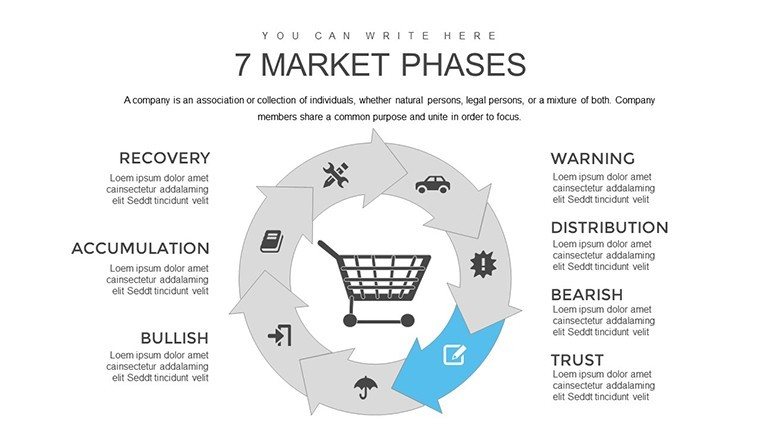
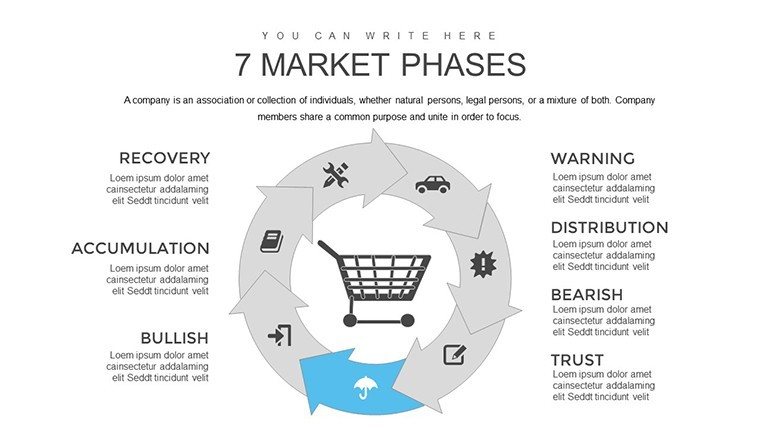
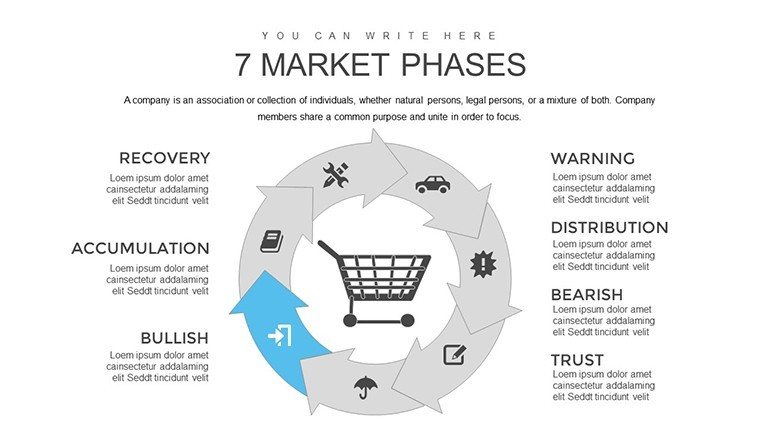
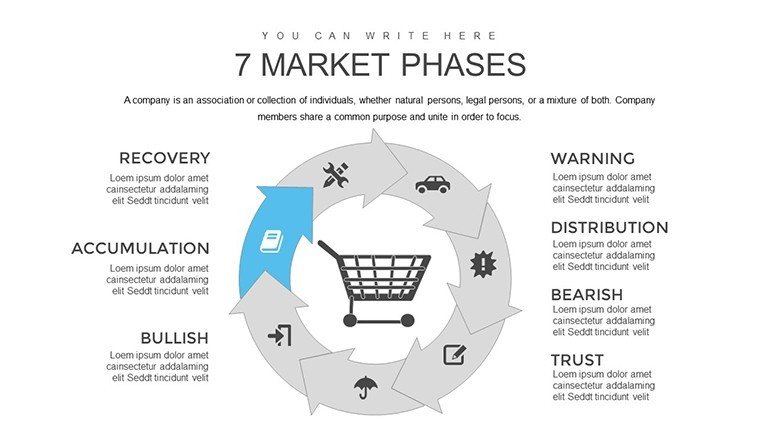
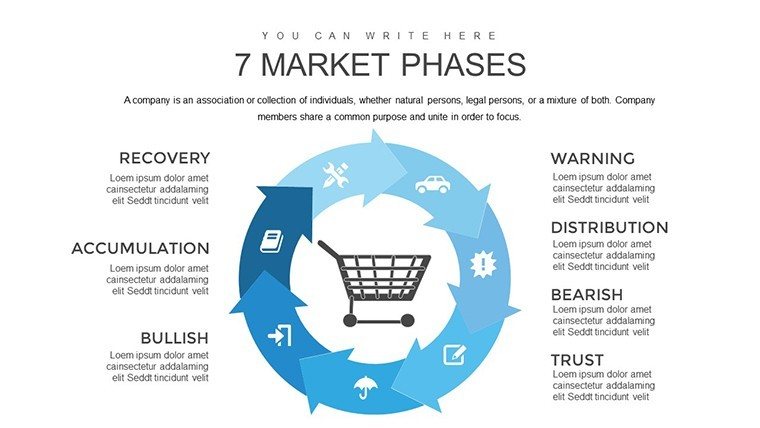
The financial markets are a dynamic arena, full of ups, downs, and unexpected turns that can make or break investment strategies. What if you could demystify these cycles with visuals that turn complex data into actionable insights? Our 7 Market Phases PowerPoint Charts Template provides exactly that, featuring 20 meticulously crafted, editable slides that outline the seven key stages of market evolution - from expansion and peak exuberance to contraction and recovery. Tailored for investors, financial analysts, and educators, this tool helps you present market trends with precision, fostering better decision-making in volatile environments. Forget generic graphs; these slides incorporate detailed explanations and customizable elements to fit your narrative, whether you're forecasting for a boardroom or teaching in a classroom. By visualizing phases like bull markets with upward-trending lines and bear phases with cautionary downturns, you'll engage your audience, highlighting patterns that inform timing and risk management. Step into a realm where market understanding isn't just theoretical but vividly illustrated, empowering you to stay ahead of the curve.
Delve into Market Dynamics Through Expert Design
This template goes beyond surface-level depictions, offering a deep dive into each phase with charts that capture essence and implications. For example, the expansion phase slide might feature growth curves annotated with economic indicators, while the recession phase uses shaded areas to denote contraction periods. Financial professionals often cite Elliott Wave theory or Dow's principles when discussing cycles; our designs align with these, providing a foundation for credible analysis. Customize to include your data sets, perhaps overlaying historical S&P 500 trends to illustrate real-world applications.
Standout Features for Financial Storytelling
- Phase-Specific Charts: Seven dedicated visuals, each with concise annotations for quick comprehension.
- Customization Options: Edit shapes, colors, and text to align with your branding or specific market scenarios.
- Data Compatibility: Easily import figures from Excel for live updates in presentations.
- Visual Enhancements: Incorporate icons representing growth (arrows up) or caution (warning signs) for added impact.
- Multi-Version Support: Works across PowerPoint versions, ensuring accessibility for all users.
These elements draw from established financial modeling practices, enhancing your authority in discussions on market behavior.
Practical Scenarios: Bringing Phases to Life
Envision an investor reviewing portfolio adjustments: Using the template, they map current conditions to the 'peak' phase with bubble charts showing overvaluation risks, then project into 'correction' with line graphs forecasting dips. In a corporate setting, a financial analyst might use cycle diagrams during earnings calls to explain quarterly performance against broader market phases, building stakeholder trust through transparent visuals.
For educators, the template serves as a teaching aid, breaking down phases in lectures with step-by-step animations that reveal trends over time. Consider a case study on the 2008 financial crisis: Slides could sequence from expansion (pre-2007 boom) to trough (2009 lows), using area charts to quantify impacts on sectors like real estate.
Workflow Integration: A Step-by-Step Approach
- Research Phase Alignment: Gather data on current indicators like GDP or volatility indices.
- Populate Slides: Input metrics into editable fields, adjusting visuals for emphasis.
- Enhance Narrative: Add notes or hyperlinks to sources for deeper dives.
- Present Dynamically: Use slide transitions to simulate cycle progression.
- Analyze Feedback: Post-presentation, refine based on audience insights for future uses.
This process mirrors quantitative analysis techniques used by firms like Goldman Sachs, where visual aids support data-driven narratives.
Superior to Standard Tools: Why Choose This?
Basic PowerPoint lacks the thematic integration for financial cycles, often resulting in disjointed slides. Our template offers cohesive designs inspired by technical analysis standards, like those from the CFA Institute, ensuring professional output. Users experience reduced preparation time, with built-in explanations that eliminate the need for extensive scripting. Compared to free resources, it provides higher fidelity graphics and LSI terms like "market cycle visualization" for better internal documentation.
Pro Tips from a Financial Perspective
Leverage contrasting colors for bullish (greens) versus bearish (reds) phases to evoke emotional responses. Keep data labels minimal to avoid clutter, focusing on key turning points. For hybrid meetings, embed video clips of market news within slides for contextual richness. Always cross-reference with reliable sources like Bloomberg data to uphold trustworthiness.
In academic contexts, adapt for simulations, projecting hypothetical phases based on economic models. Businesses can use it for risk assessments, integrating with tools like Monte Carlo simulations for probabilistic forecasting.
Seize Market Opportunities Now
With the 7 Market Phases PowerPoint Charts Template, you're not just presenting data - you're unlocking strategic foresight. Ideal for navigating uncertainty, it transforms abstract cycles into tangible plans. Download and chart your path to informed success today.
Frequently Asked Questions
What are the seven market phases covered?
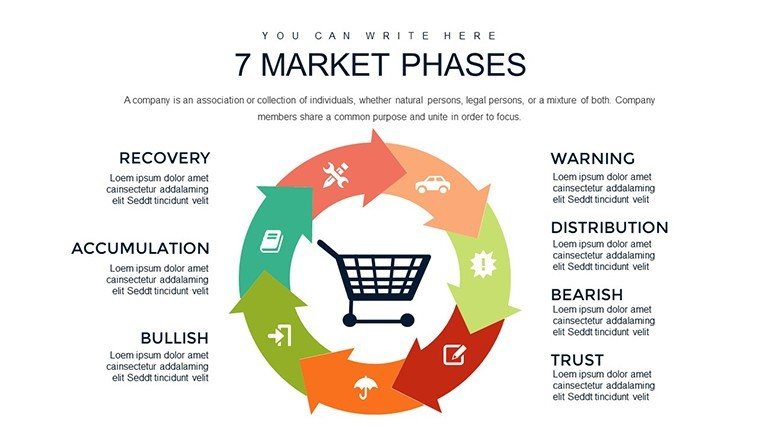
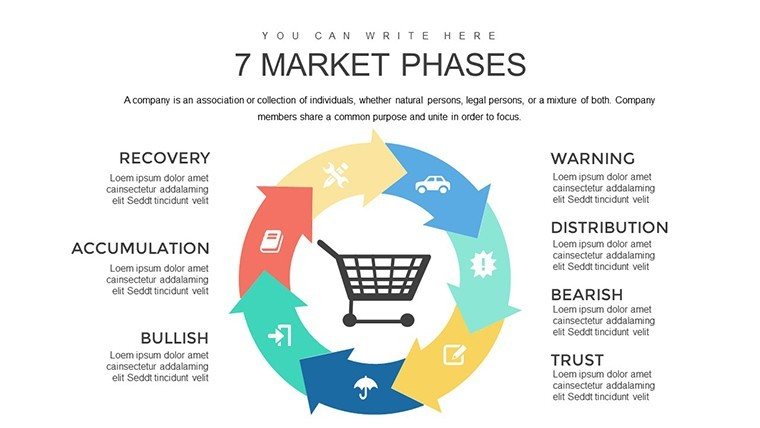
The template details expansion, peak, contraction, trough, recovery, bull, and bear markets with visual aids.
Can I add my own data to the charts?
Yes, all charts are editable, allowing seamless integration of custom datasets.
Is it suitable for beginners in finance?
Absolutely, with built-in explanations making it accessible while educational.
How does it differ from free templates?
It offers professional designs and phase-specific customizations not found in basics.
Compatible with older PowerPoint versions?
Yes, it supports various versions for broad usability.
Good for
- Project roadmaps and sprint plans
- Product launch timelines
- Quarterly or annual review decks
- Company history and milestone summaries
Licence
reviews
The experience was smooth except minor compatibility hiccups on older software versions. Still happy with purchase.
Downloaded for a quick project and ended up using multiple slides. The consistency across charts is impressive.
I kinda wish there were more horizontal layouts but the vertical ones worked great for my report.
This template boosted my confidence before the board meeting. Data looked trustworthy and professional.
FAQ
Will it work in Google Slides?
Are fonts embedded?
Can I use this for client work?
What's the refund policy?
Do you update the template after purchase?
Similar templates
See all PowerPoint Charts →

All 20 slides