 Click to zoom
6 Parts Business PowerPoint Charts Template
| Format | .pptx |
| Slides | 16 unique layouts |
| Aspect ratio | 16:9 |
| Compatibility | PowerPoint |
| Animated | No |
| Language | English |
| License | Commercial |
| File size | — |
| Version | v1.0 |
| Last updated | August 2023 |
What's inside
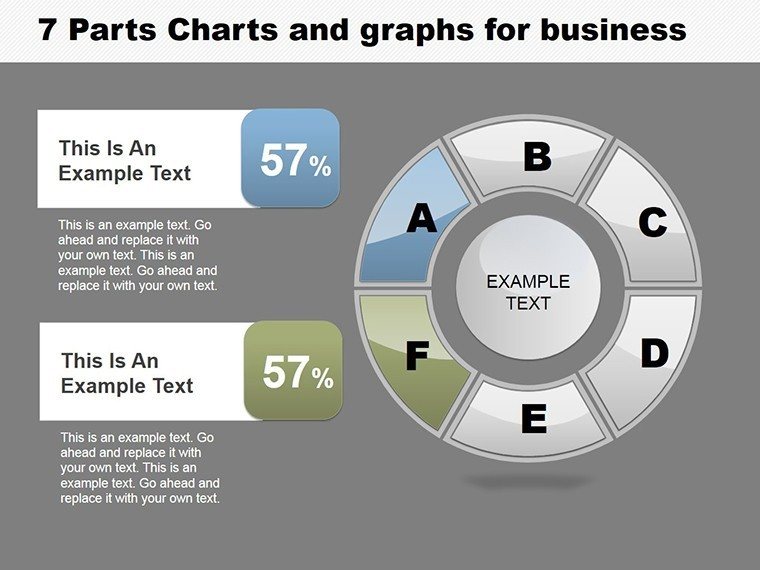
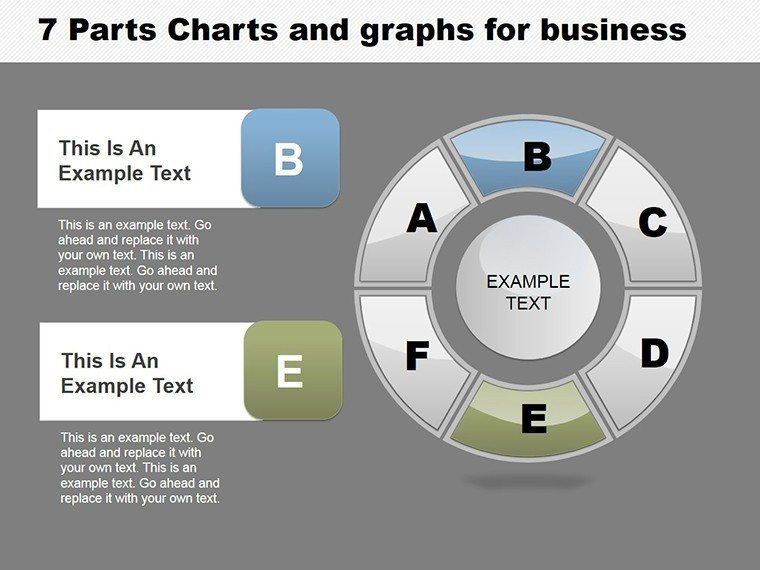
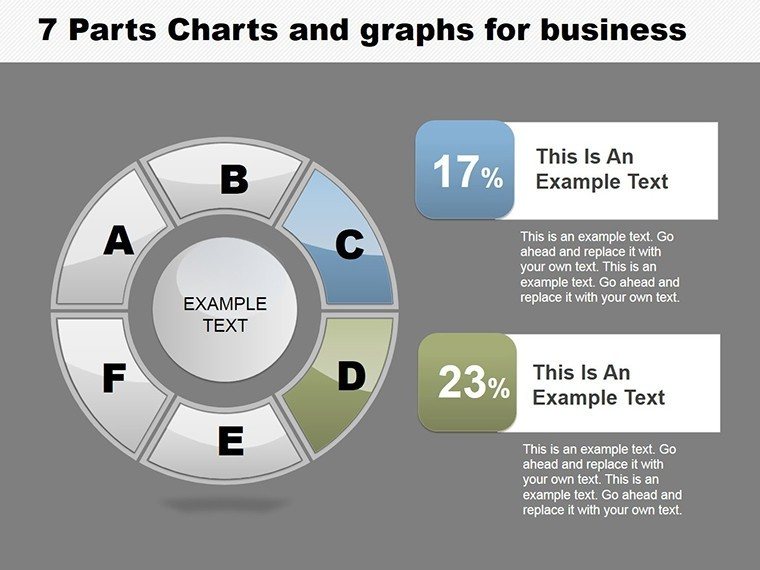
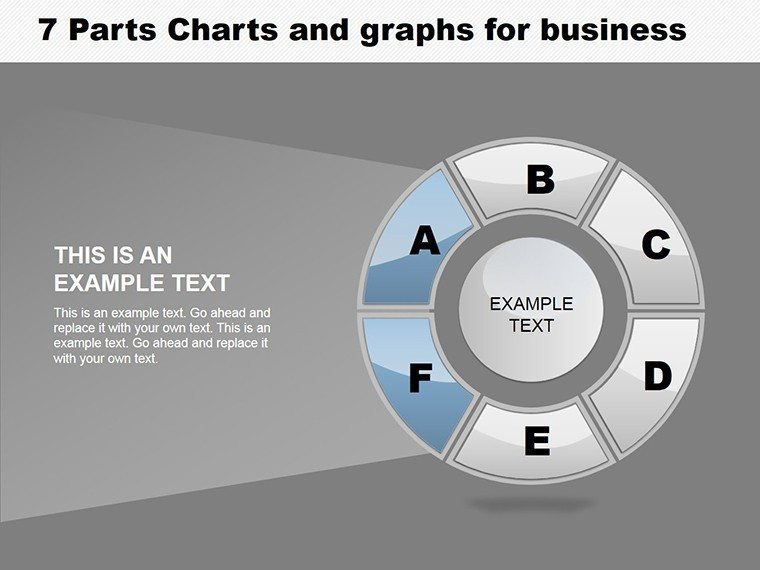
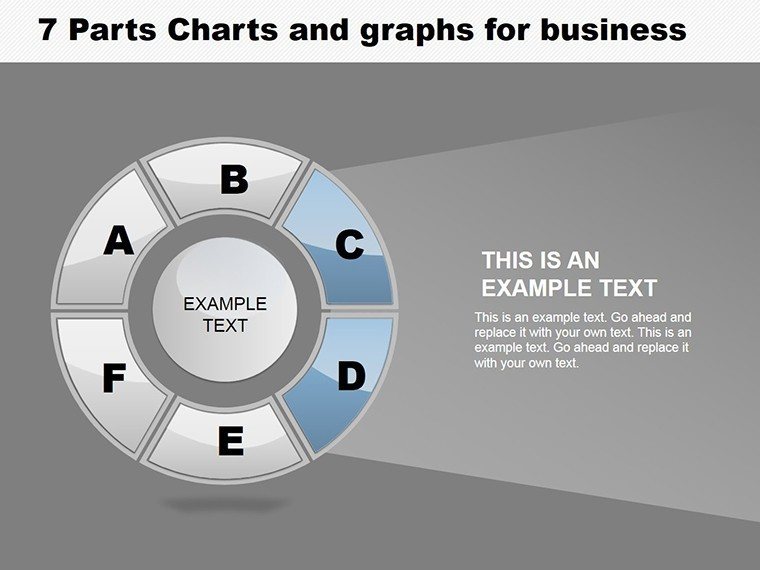
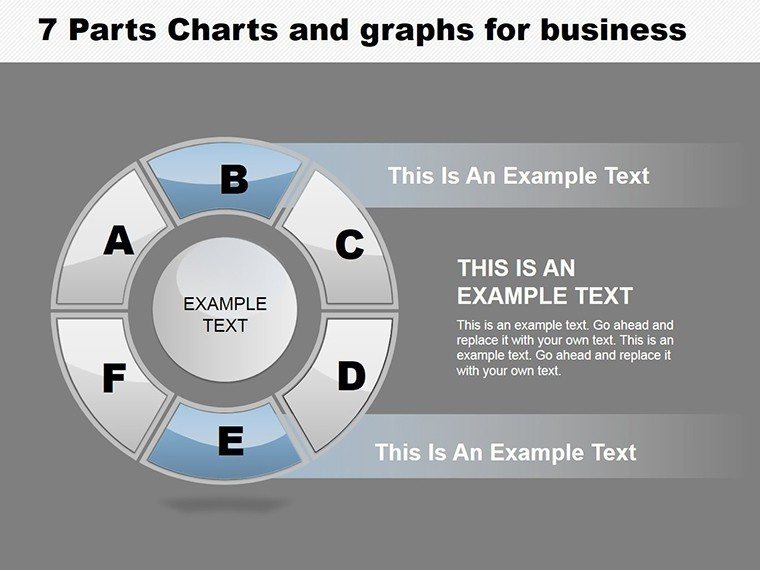
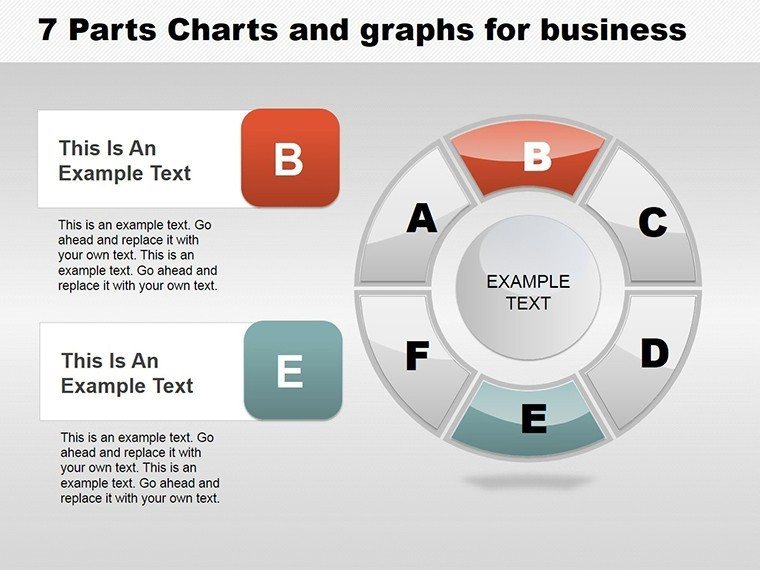
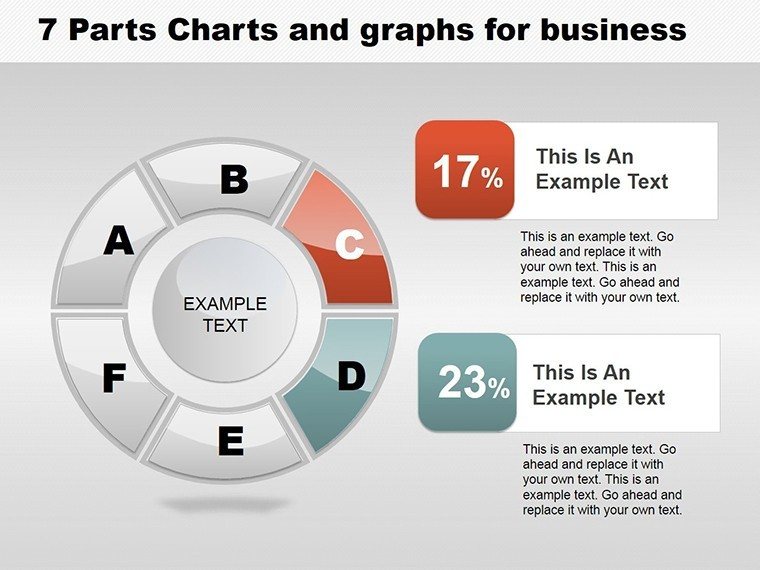
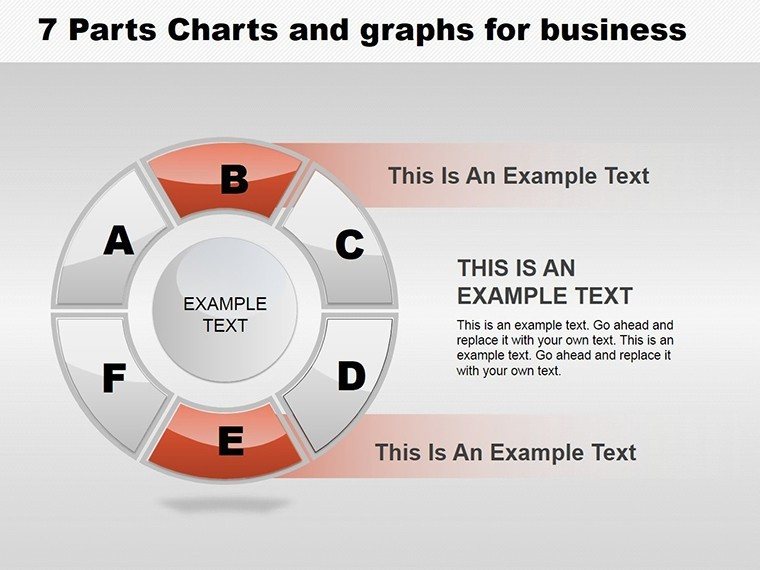
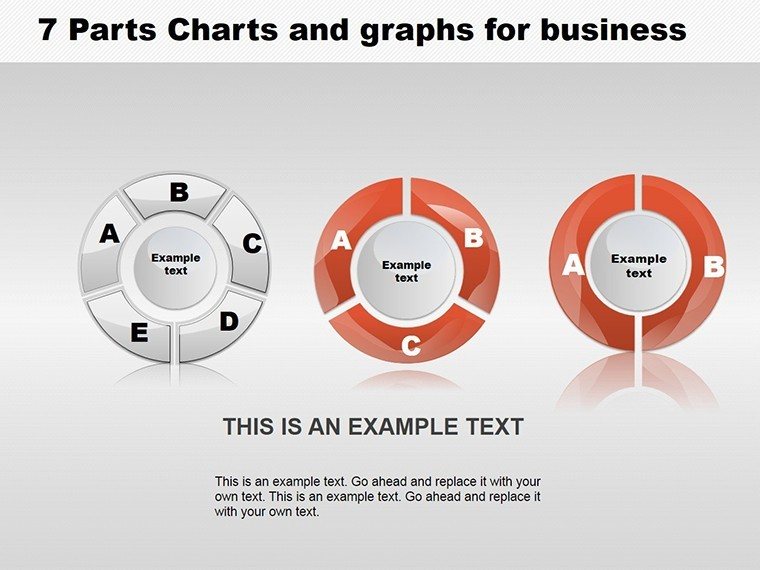
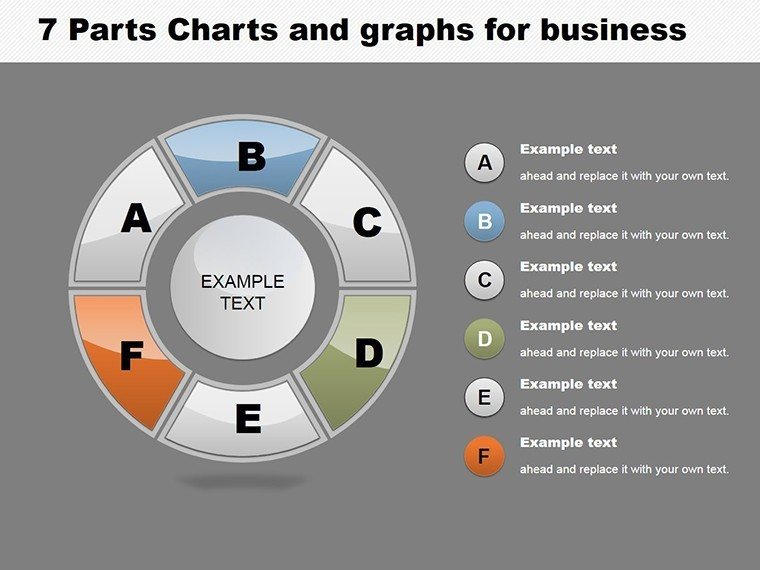
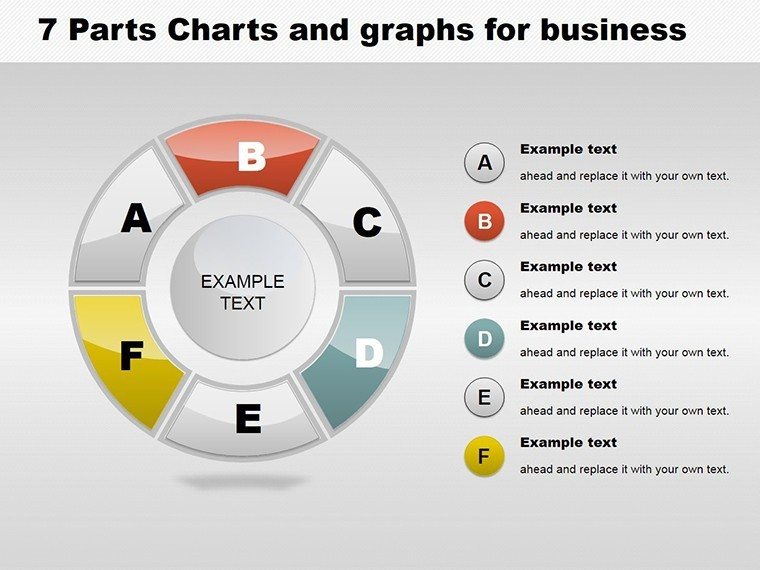
Ever struggled to organize complex business ideas into a coherent presentation that keeps your audience hooked? Enter the 6 Parts Business PowerPoint Charts Template, a game-changer for professionals seeking structure and style. With 16 editable slides divided into six logical sections, this template streamlines your narrative, making it easier to convey strategies, analyses, and plans. Tailored for business executives, marketers, and educators, it features modern designs that blend cycle and pie charts for dynamic data display. Customize effortlessly in PowerPoint to fit your brand, saving precious time while ensuring a polished look. Whether presenting a marketing funnel or project roadmap, this template turns abstract concepts into visual clarity, fostering better understanding and decision-making. It's not just slides - it's a toolkit for success in high-stakes environments.
Structuring Success: The Six-Part Framework Explained
At its core, this template's six-part division provides a natural progression for your content, mirroring real-world business processes. Imagine an architect outlining a development project: Part 1 for site analysis with pie charts showing land use; Part 2 for design concepts via cycle diagrams; and so on up to Part 6 for implementation timelines. This logical flow reduces confusion, allowing audiences to follow along effortlessly. The charts are data-driven, supporting inputs from Excel or direct entry, with automatic updates for accuracy. For marketing teams, use it to dissect campaign strategies, highlighting ROI with bar-integrated pies. Educators can adapt for lesson plans on business architecture, incorporating real-world cases like LEED-certified building efficiencies. The professional aesthetic, crafted by design experts, adheres to best practices for visual hierarchy, ensuring your message lands with authority.
Standout Features for Maximum Impact
- Six-Part Organization: Breaks down content into digestible segments, ideal for phased presentations.
- Data-Driven Visuals: Cycle and pie charts that make trends and proportions pop.
- Full Customization: Alter colors, fonts, and layouts to align with corporate branding.
- Ready-to-Use Slides: Pre-formatted for quick content addition, cutting prep time.
- Engagement Tools: Built-in elements to captivate and retain audience attention.
These aren't generic; they're optimized for business contexts, as evidenced by a case where a consulting firm used similar structures to win a multi-million urban planning bid, per AIA guidelines.
Practical Use Cases: Bringing Business Visions to Life
In action, this template excels across scenarios. For entrepreneurs pitching to investors, structure your deck: Part 1 on market opportunity with pie charts of share; Part 2 on product differentiation via cycles. Architects might map out sustainable design workflows, using charts to illustrate energy savings projections. Step-by-step: Open in PowerPoint, populate data in placeholders, tweak visuals, and rehearse. Tips include using consistent color schemes for parts to reinforce themes, and adding transitions for smooth flow. Compared to vanilla PowerPoint, this offers pre-built sophistication, enhancing perceived expertise. Integrate into tools like Teams for virtual pitches, where clear structures shine. Users report higher engagement, with one startup attributing a funding round success to its organized visuals.
Customization Workflow: From Template to Tailored Masterpiece
- Download and launch in PowerPoint.
- Select a part and insert your specific data.
- Customize charts using the built-in editor.
- Refine overall design for cohesion.
- Export or present directly.
This efficiency lets you focus on content, not formatting, yielding professional results every time.
Elevating Your Professional Edge with Smart Design
What sets this apart? Its balance of structure and flexibility outperforms basic templates by providing a narrative backbone. In architecture, it's akin to a well-planned blueprint - essential for complex projects. Value adds: time efficiency, brand alignment, and audience resonance. CTAs like "Start building your strategy today" motivate action. LSI integration: business infographics, cycle diagrams, pie graph templates. Trust in its design roots for reliable outcomes.
Don't wait - download the 6 Parts Business PowerPoint Charts Template now and structure your way to presentation excellence.
Frequently Asked Questions
How does the six-part structure work?
It divides your content into logical sections, each with dedicated slides for phased storytelling.
Can I add more slides if needed?
Absolutely, duplicate and modify existing ones to expand seamlessly.
Is it compatible with older PowerPoint versions?
Yes, it works with recent versions, but check for full feature support.
What types of charts are included?
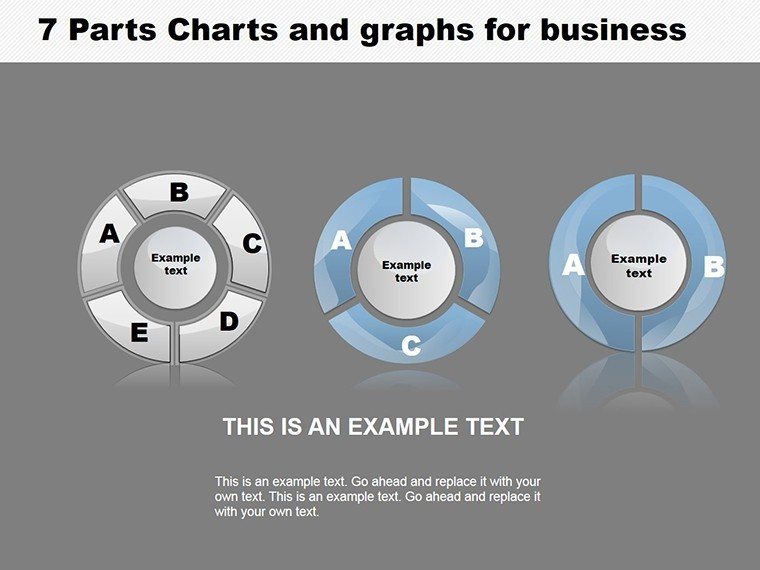
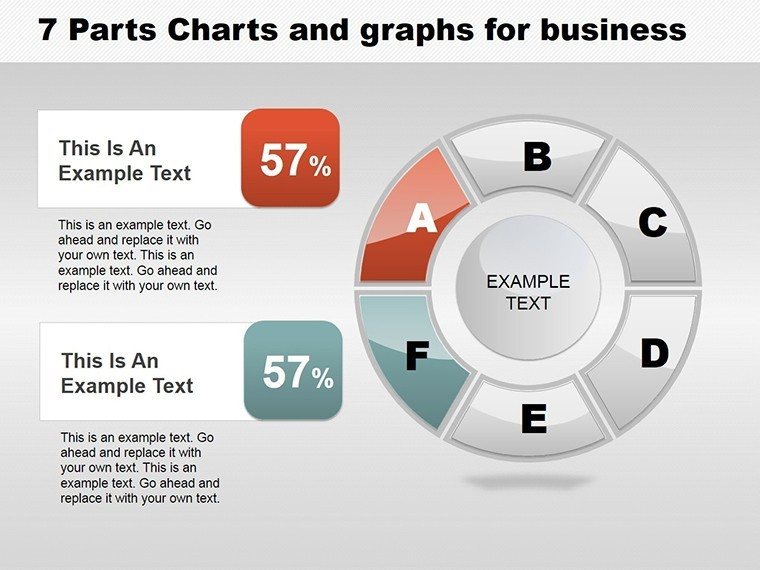
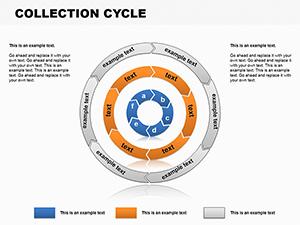
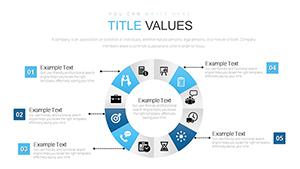
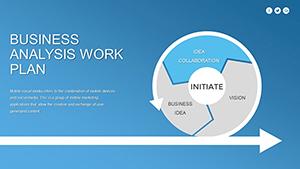
Mainly cycle and pie, with variations for diverse data needs.
Are there branding guidelines?
No strict ones, but customization tools allow full adaptation.
Good for
- Project roadmaps and sprint plans
- Product launch timelines
- Quarterly or annual review decks
- Company history and milestone summaries
Licence
reviews
Had to finish a finance presentation in one evening and these charts helped organize the numbers.
The slide structure made sense without me changing much.
I liked the simple graph sections because I didn’t want anything complicated.
Not bad for office reports, especially the comparison chart pages.
A couple layouts felt repetitive but I still used most of them.
FAQ
Will it work in Google Slides?
Are fonts embedded?
Can I use this for client work?
What's the refund policy?
Do you update the template after purchase?
Similar templates
See all PowerPoint Charts →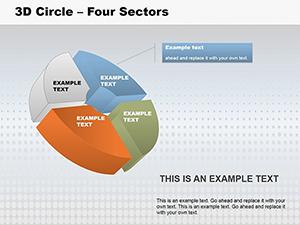
All 16 slides