 Click to zoom
3D Hexagons Collection Keynote Charts: Elevate Data to New Dimensions
| Format | .pptx |
| Slides | 20 unique layouts |
| Aspect ratio | 16:9 |
| Compatibility | PowerPoint |
| Animated | No |
| Language | English |
| License | Commercial |
| File size | — |
| Version | v1.0 |
| Last updated | October 2022 |
What's inside
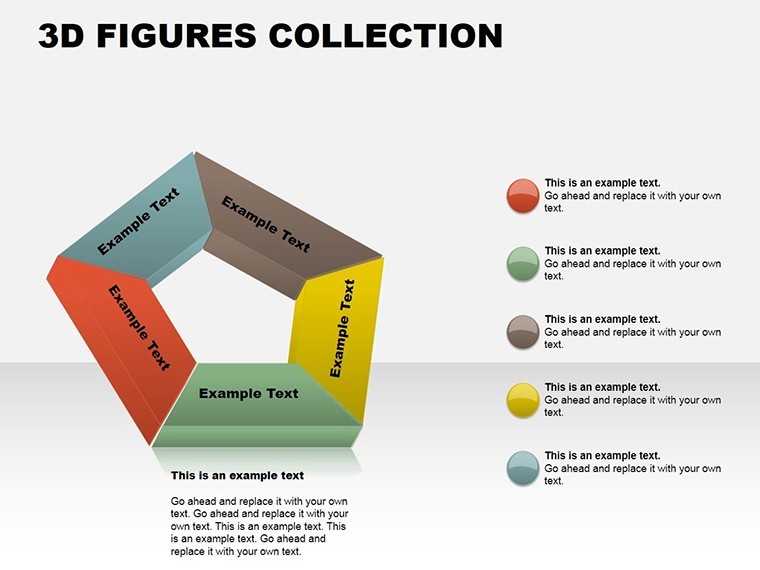
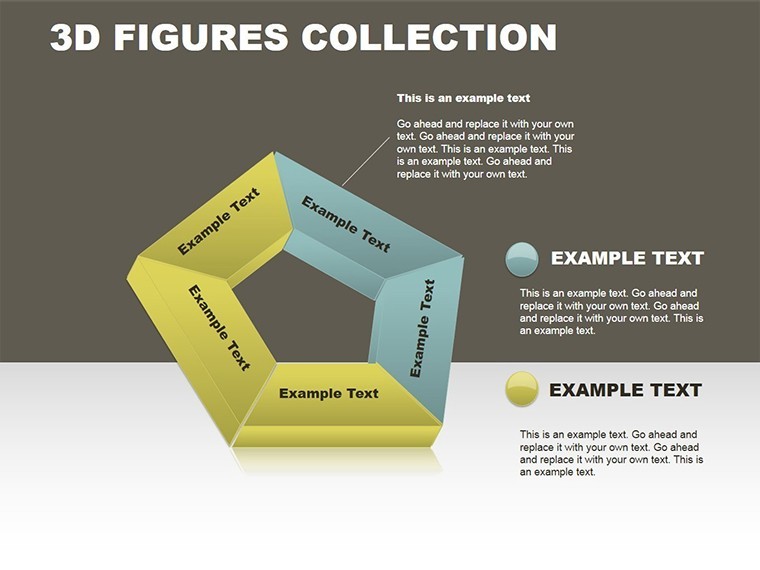
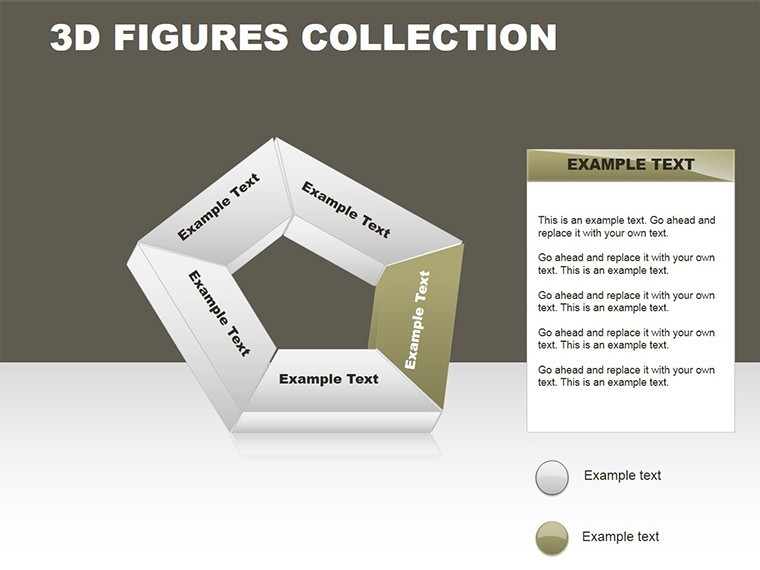
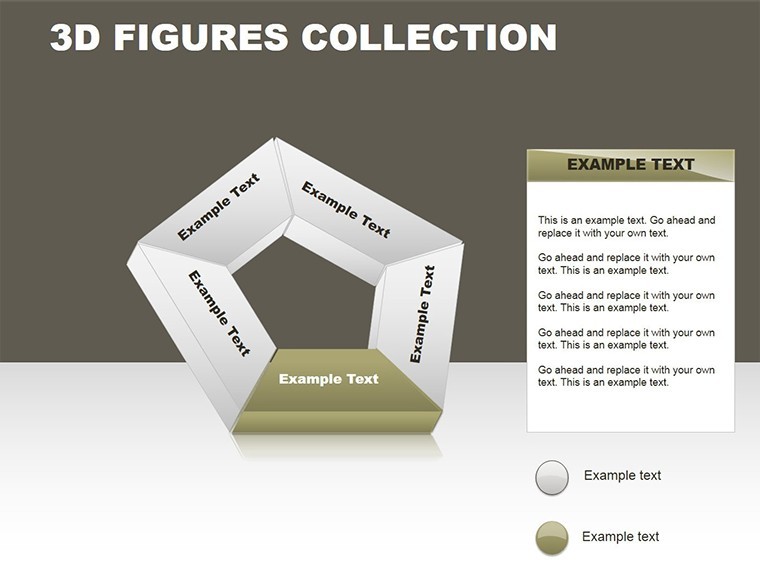
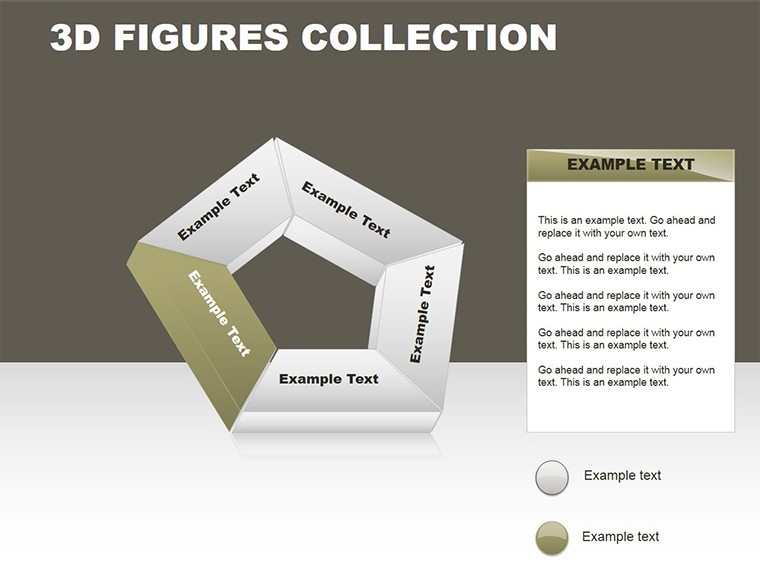
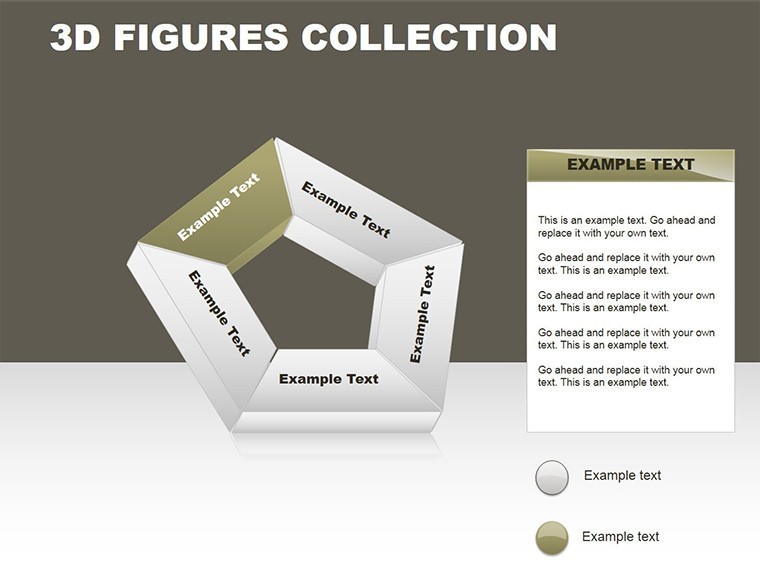
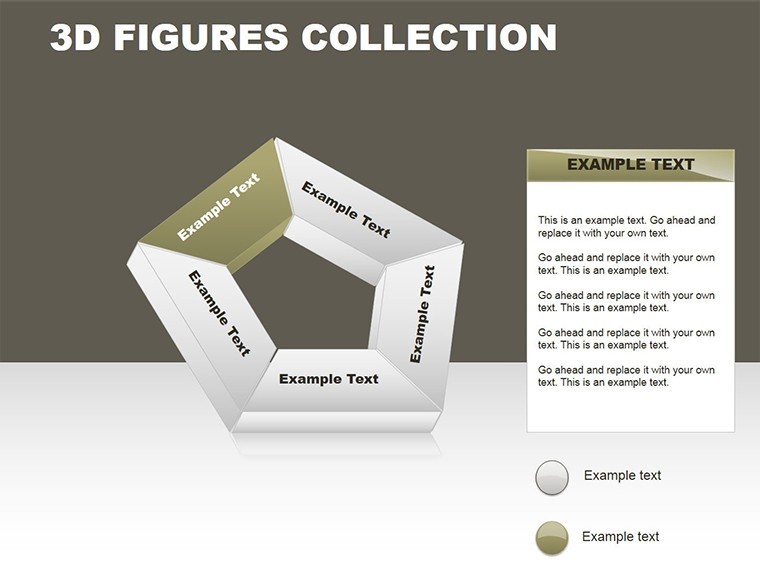
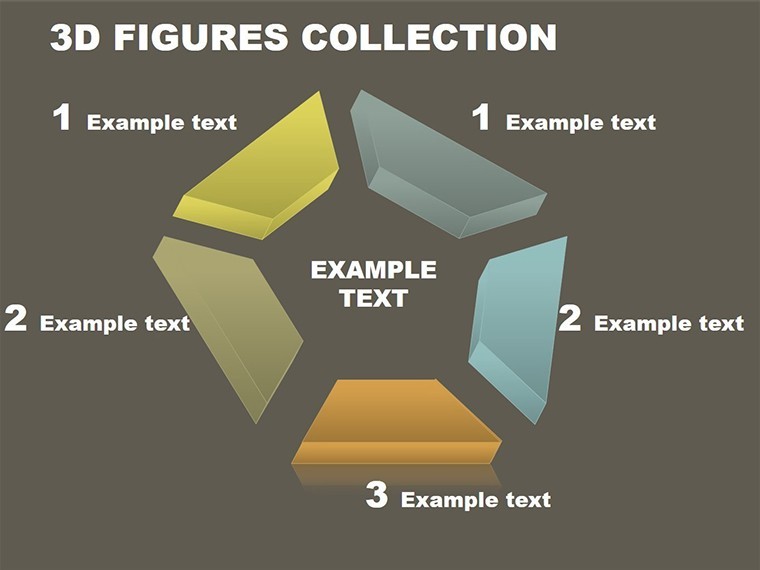
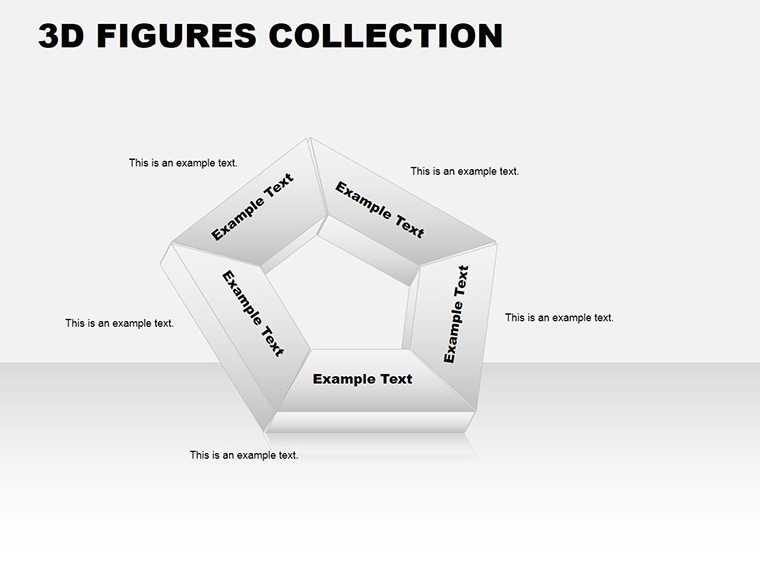
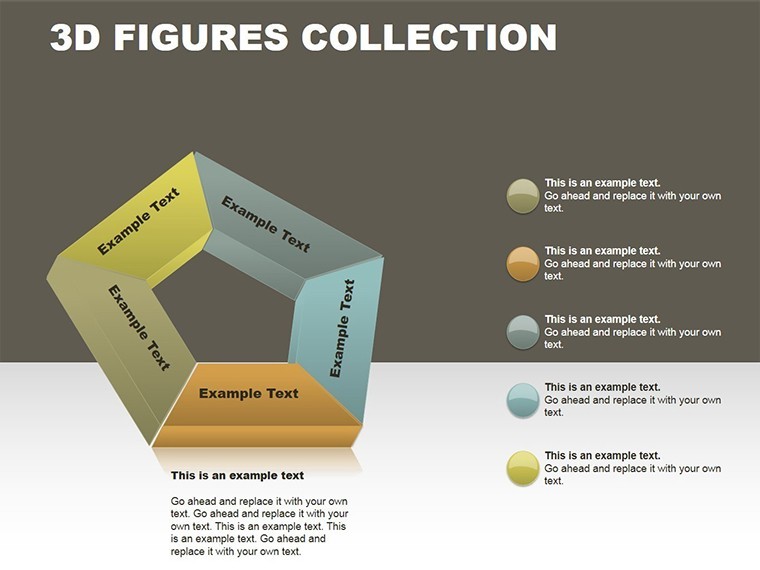
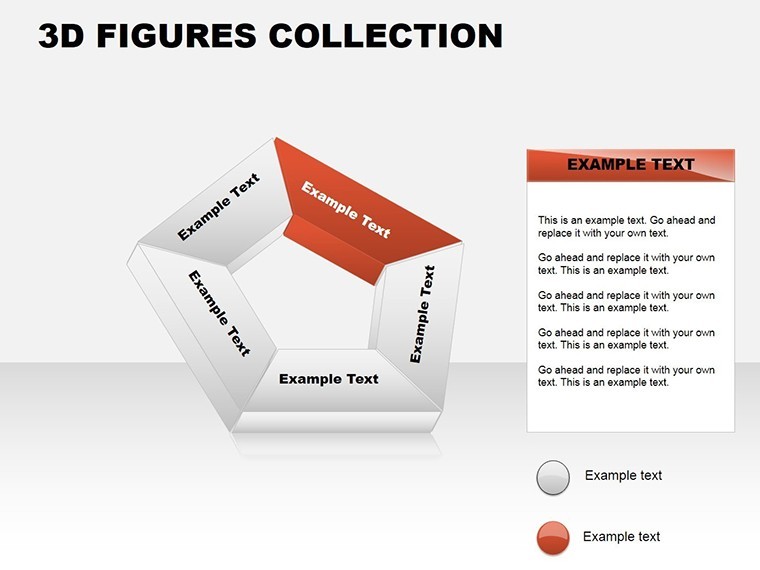
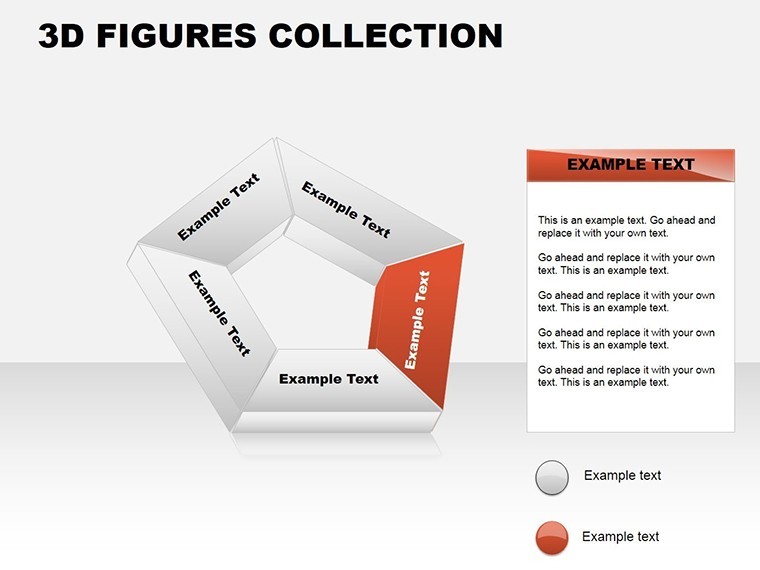
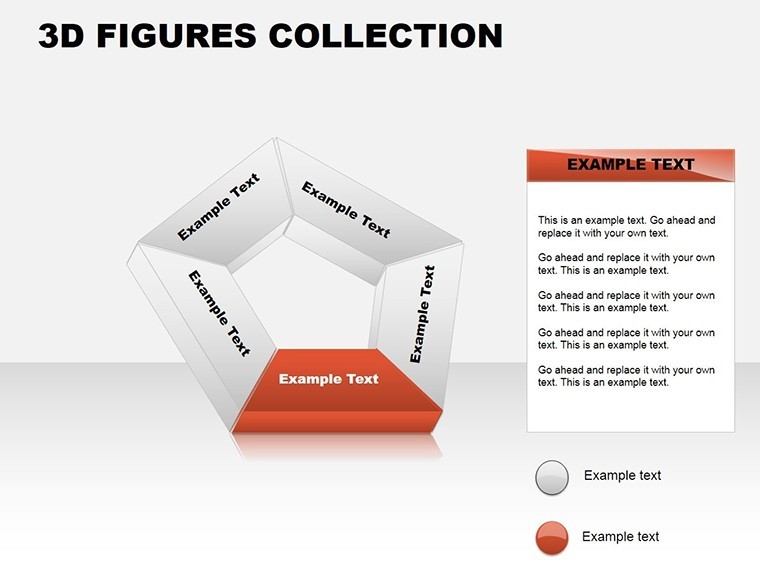
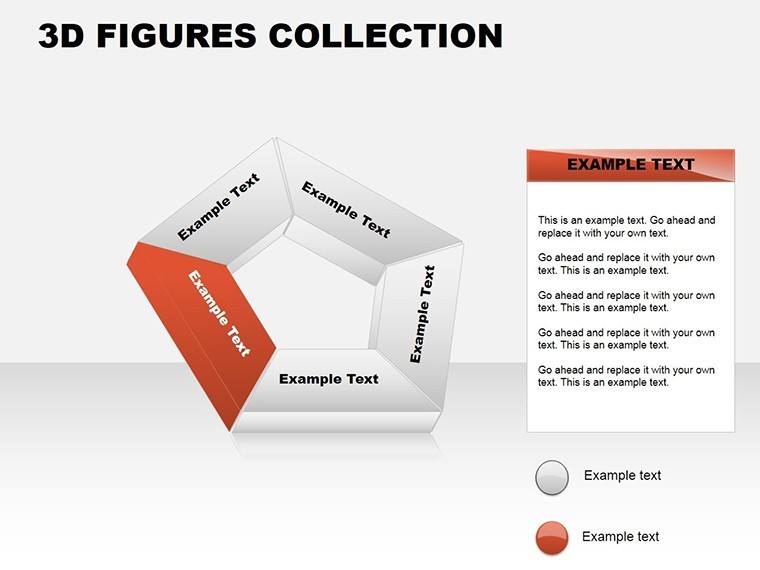
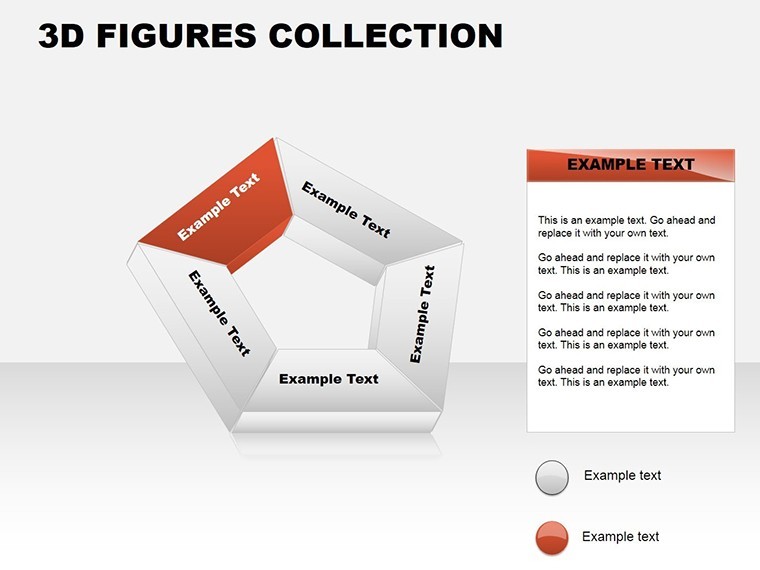
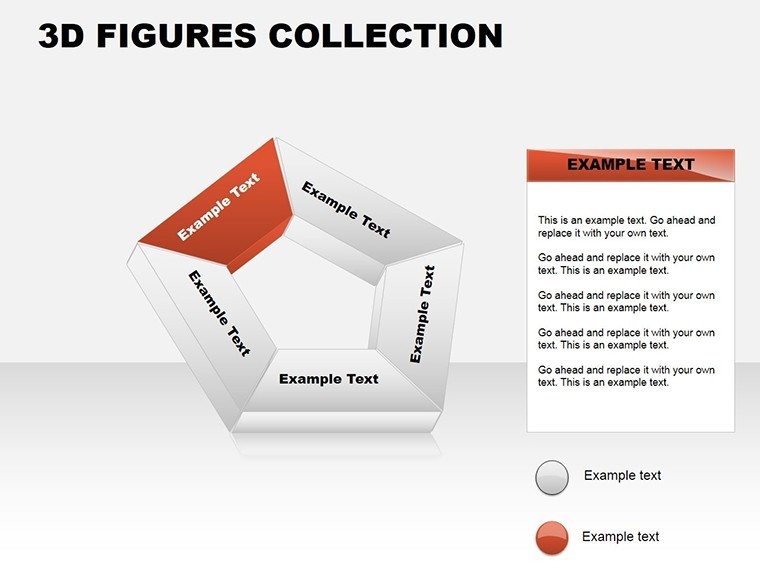
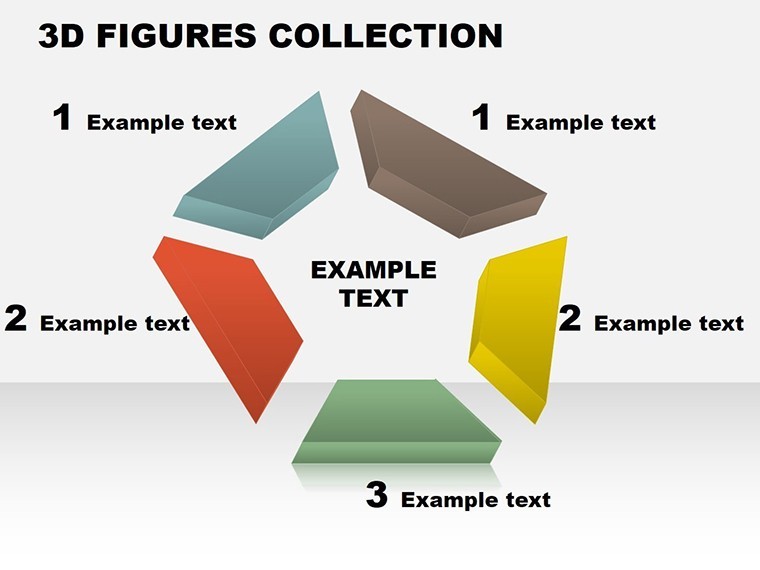
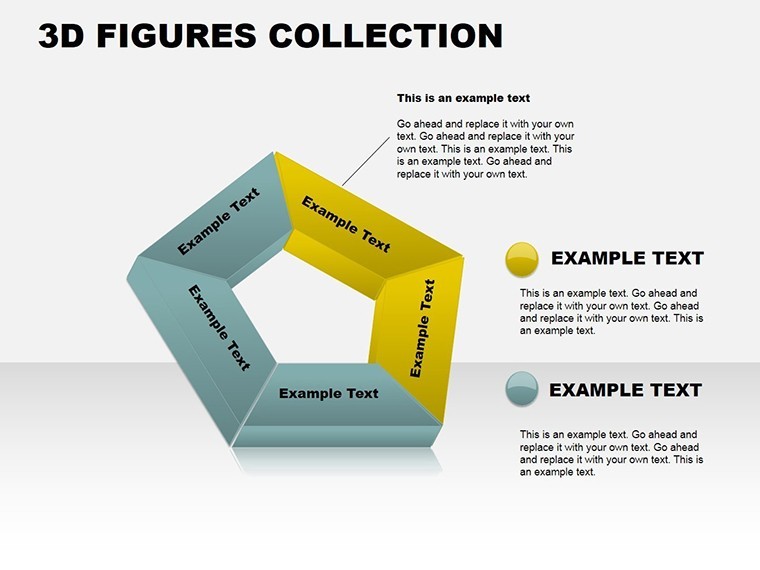
In an era where data drives decisions, flat charts fall short of capturing the multifaceted nature of priorities and factors. Step into the third dimension with the 3D Hexagons Collection Keynote Charts template, featuring 20 editable slides that render information in volumetric splendor. Exclusively for Keynote, this template harnesses the software's rendering capabilities to produce hexagons that pop, allowing you to layer complexities like market segments or risk assessments with depth and interactivity. Ideal for analysts, strategists, and presenters seeking to make abstract concepts tangible, it turns routine reports into immersive experiences.
Inspired by modern data visualization principles from experts at Tableau and Gartner, this collection emphasizes hexagonal structures for their natural efficiency in packing information - perfect for honeycomb-like breakdowns of interconnected elements. A standout slide might display a 3D cluster of hexagons representing supply chain components, where size denotes impact and color signals status, enabling quick identification of bottlenecks. Research from Nielsen Norman Group shows 3D visuals can increase comprehension by 40% in complex datasets, making this template a game-changer for avoiding information overload in high-stakes meetings.
Core Features Driving the 3D Hexagons Impact
Boasting 20 slides, each hexagon is a volumetric masterpiece, editable down to shadows and rotations for personalized depth. The template's design philosophy prioritizes ease, so you input data and watch Keynote animate the builds automatically.
- Volumetric Editable Elements: Rotate, resize, and recolor hexagons independently, with built-in gradients for realistic 3D effects that adapt to light sources.
- Diverse Hexagon Layouts: From single mega-hex for core priorities to clustered formations for factor interrelations, covering radial, linear, and stacked configurations.
- Integrated Prioritization Tools: Slides with sortable hexagons by size or opacity, ideal for SWOT analyses where strengths loom largest.
- Seamless Keynote Optimization: Leverages native 3D modeling for smooth performance, plus export options to video for non-Keynote audiences.
Professionals in consulting firms, like those emulating McKinsey's data decks, appreciate how it cuts design time by 60%, focusing efforts on insights rather than formatting. The volumetric approach adds a layer of sophistication, aligning with trends in immersive presentations seen at TEDx events.
Versatile Use Cases for 3D Hexagonal Visualization
Deploy this template where multidimensional data shines. In business strategy sessions, use a hexagon mosaic to prioritize product features, weighting user feedback against development costs - mirroring how companies like Google visualize roadmap decisions. For project management, a 3D stack slide can represent resource allocation, with hexagons expanding on hover (in interactive modes) to reveal sub-factors like timelines and budgets.
Marketing teams find it transformative for audience segmentation; envision hexagons sized by demographic reach, colored by engagement levels, to strategize campaigns effectively. A real-world example: A healthcare analytics firm used similar visuals to map patient flow factors, identifying priority interventions that improved outcomes by 20%, per internal case studies. Educators can adapt for lesson plans, breaking down scientific concepts into hexagonal models for student interaction.
Workflow is straightforward: Launch in Keynote, populate via data tables, apply 3D extrusions, and sequence animations to unveil layers progressively. Tip: Combine with Keynote's perspective tools for fly-through effects, simulating a journey through your data ecosystem.
Outshining Traditional 2D Charts
Where flat pies obscure hierarchies, these 3D hexagons reveal them - offering spatial relationships that 2D can't match, without the vertigo of overdone effects. It's trusted for its balance, ensuring accessibility while wowing visually.
For scalability, duplicate slides for scenario modeling, like best/worst-case factor comparisons. Post-use, the template's modularity allows repurposing elements across decks, maximizing ROI on your presentation investments.
Dimension Up Your Presentations Immediately
Don't let data lie flat when it can soar in 3D. The 3D Hexagons Collection Keynote Charts template invites you to explore priorities with unprecedented clarity. Grab it today and redefine how you present factors - your insights deserve the depth.
Frequently Asked Questions
Are the 3D hexagons fully editable in Keynote?
Yes, every aspect from shape, color, and depth to positioning is customizable using Keynote's 3D controls for tailored visuals.
What types of data best suit this hexagonal collection?
It's ideal for categorical data like priorities, factors, or segments, where spatial relationships enhance understanding over linear formats.
Can animations be added to the volumetric elements?
Absolutely - Keynote supports rotation and scaling animations on hexagons, creating dynamic reveals for engaging presentations.
Is it suitable for industries beyond business?
Definitely; applications span education, healthcare, and design, wherever multifaceted data needs volumetric representation.
How many slides are included, and what's their focus?
20 editable slides, centered on hexagon variations for prioritization, with flexibility for custom data integration.
Does it export well to other formats?
Yes, maintains 3D integrity in PDF or video exports, though full interactivity requires Keynote viewing.
Good for
- Project roadmaps and sprint plans
- Product launch timelines
- Quarterly or annual review decks
- Company history and milestone summaries
Licence
reviews
Some of the graph labels were hard to read until I resized them.
I appreciated that the slides stayed simple.
The process arrows actually matched my presentation topic well.
Good enough for quick edits before presenting.
Used this template for a startup pitch and the charts looked clean.
FAQ
Will it work in Google Slides?
Are fonts embedded?
Can I use this for client work?
What's the refund policy?
Do you update the template after purchase?
Similar templates
See all Keynote Charts →
All 20 slides