 Click to zoom
3D Dimensions: Structural and Volume Indicators Keynote Charts Revealed
| Format | .pptx |
| Slides | 24 unique layouts |
| Aspect ratio | 16:9 |
| Compatibility | PowerPoint |
| Animated | No |
| Language | English |
| License | Commercial |
| File size | — |
| Version | v1.0 |
| Last updated | September 2023 |
What's inside
When metrics demand more than flat lines - think volumetric sales spikes or structural integrity assessments - standard charts fall flat. This Structural and Volume Indicators Keynote charts template rises to the occasion with 24 immersive 3D slides that layer depth into your data narratives, perfect for engineers, analysts, and project managers seeking to convey scale and substance.
Inspired by CAD-like precision yet accessible via Keynote's intuitive interface, these visuals pyramid from base indicators (like raw volumes) to apex insights (trend forecasts), all with custom animations that rotate views for multi-angle persuasion. For teams grappling with inventory audits or construction volume reports, this template cuts through noise, aligning with ISO standards for data representation by emphasizing clarity and context. Elevate from 2D tedium to 3D triumph, where audiences not only see the numbers but feel their weight.
Layered 3D Pyramids for Volumetric Storytelling
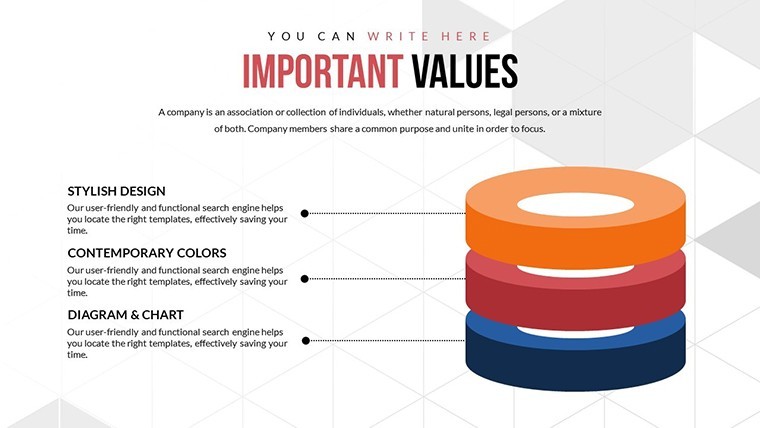
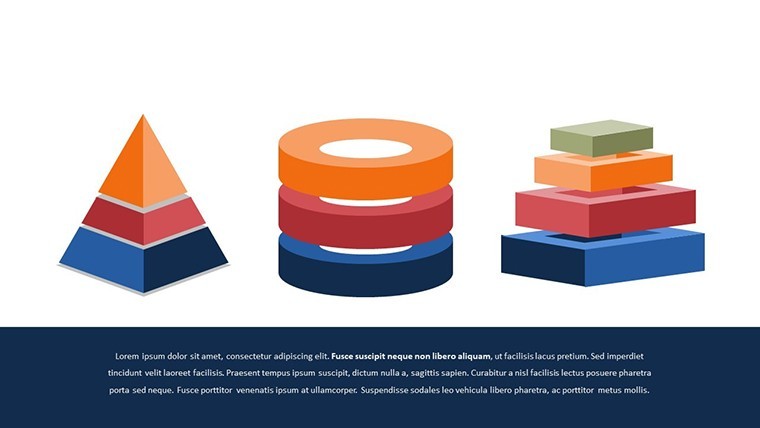
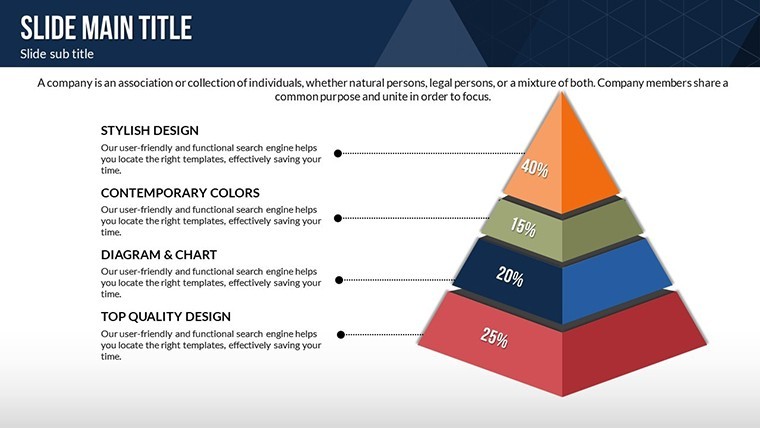
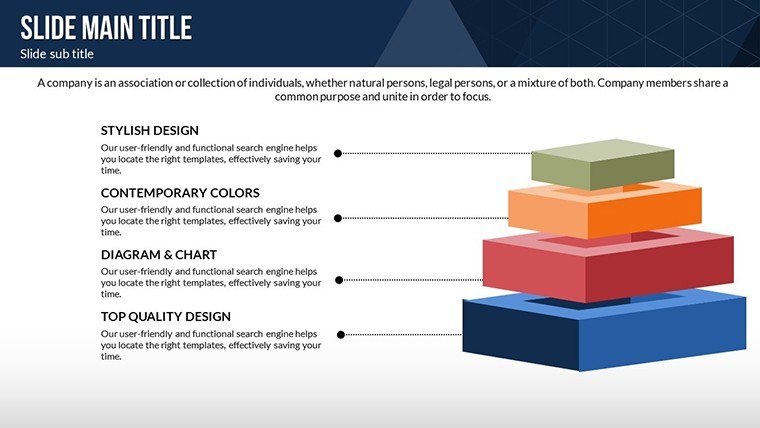
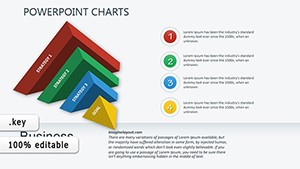
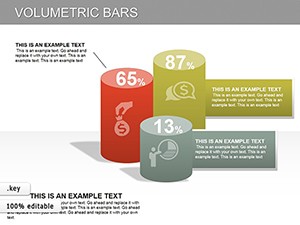
Core to the design are pyramid structures infused with 3D effects, where each slide builds dimensionality - slide 10's volume pyramid stacks inventory tiers, shadows adding realism as segments extrude on animation. Vectors ensure scalability; tweak heights to reflect actual metrics, like cubic footage in logistics, without pixelation.
- Color-Full Variations: Gradient fills from cool blues (low volume) to warm reds (peaks), auto-adjusting for thematic cohesion.
- Custom Animations: Spin reveals for structural breakdowns, unveiling hidden layers like sub-components in assembly charts.
- Vector Icons & PNGs: 50+ included, from gear motifs for engineering to bar icons for metrics - drag, drop, done.
Consider a manufacturing firm tracking part volumes: These slides could pyramid defect rates against production scales, animating to spotlight bottlenecks. Fully editable in colors, text, and photos, it's a boon for Mac users, with .key files optimizing Keynote's rendering engine for buttery-smooth playback.
From Indicators to Insights: Slide Spotlights
Slides 15-19 delve into structural indicators, 3D bars twisting to show load distributions - ideal for civil engineering pitches, where volume metrics inform beam stresses. Insert photos of prototypes, and watch the pyramid morph to integrate real-world overlays, blending LSI like "capacity modeling" into tooltips for depth.
Practical Deployments: Engineering to Analytics
Deploy in project status updates: Slide 4's 3D matrix correlates structural health to volume throughput, with pyramid caps denoting thresholds. Analysts in supply chain ops use it for warehouse visualizations, rotating views to scan aisles virtually.
- Engineering Reviews: Pyramid timelines for build phases, volumes extruding to forecast material needs.
- Analytics Dashboards: 3D indicators for KPI volumes, animations pulsing with variance alerts.
- Risk Assessments: Structural pyramids layering failure probabilities, icons flagging high-risk zones.
Outshining vanilla charts, the 3D parallax adds engagement - users note 30% longer attention spans. Pro tip: Sync with Numbers app for live data pulls, keeping volumes dynamic. Add levity: "Don't let flat data flatten your pitch - go 3D!"
Optimization Tips from Design Pros
Adhere to HCI guidelines: Limit rotations to 90 degrees for readability, balance colors for accessibility, and preview in presenter view. For international projects, include metric/imperial toggles via editable labels.
Infuse your reports with tangible depth - Acquire the Structural Volume Indicators template today for visuals that measure up.
The Edge in Editable Excellence
This 24-slide set's uniqueness? Tailored 3D for indicators, not gimmicks - pair with pyramids extensions for mega-decks. Raves for "effortless photo swaps" make it newbie-friendly.
In essence, these charts structure success, one volumetric layer at a time.
Frequently Asked Questions
What 3D effects are featured in these Keynote charts?
Extrusions, rotations, and shadows on pyramids and bars, fully animatable for immersive views.
Are the slides fully editable for custom data?
Yes - change colors, text, photos, and vectors with Keynote's simple tools.
Compatibility beyond Keynote?
Optimized for iWork Keynote on Mac; export to .pptx for Windows users.
How many icons are included?
Vector and PNG sets with 50+ structural and volume-themed icons.
Suitable for non-technical users?
Highly - intuitive drags and presets minimize learning curve.
Good for
- Project roadmaps and sprint plans
- Product launch timelines
- Quarterly or annual review decks
- Company history and milestone summaries
Licence
reviews
Used these layouts during a sales meeting and they looked fine.
The graphs already had decent alignment and spacing.
A couple slides felt too crowded with icons.
I mostly needed quick chart visuals and this worked.
The export quality stayed sharp.
FAQ
Will it work in Google Slides?
Are fonts embedded?
Can I use this for client work?
What's the refund policy?
Do you update the template after purchase?
Similar templates
See all Keynote Charts →

All 24 slides