 Click to zoom
3D Cloud Data Storage PowerPoint Charts Template: Elevate Your Tech Presentations
| Format | .pptx |
| Slides | 12 unique layouts |
| Aspect ratio | 16:9 |
| Compatibility | PowerPoint |
| Animated | No |
| Language | English |
| License | Commercial |
| File size | — |
| Version | v1.0 |
| Last updated | February 2026 |
What's inside
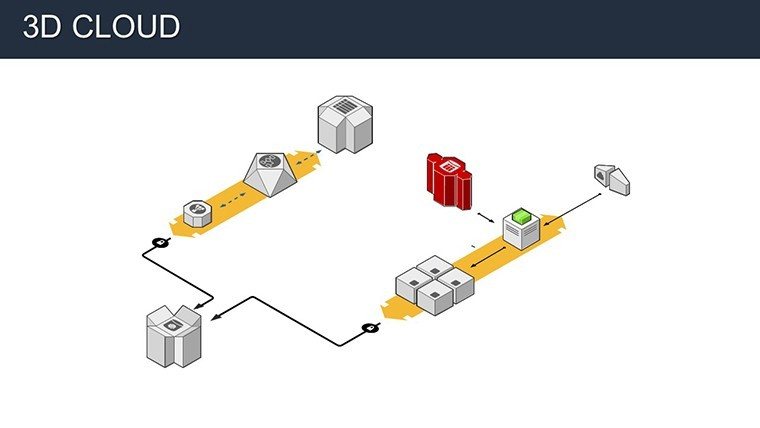
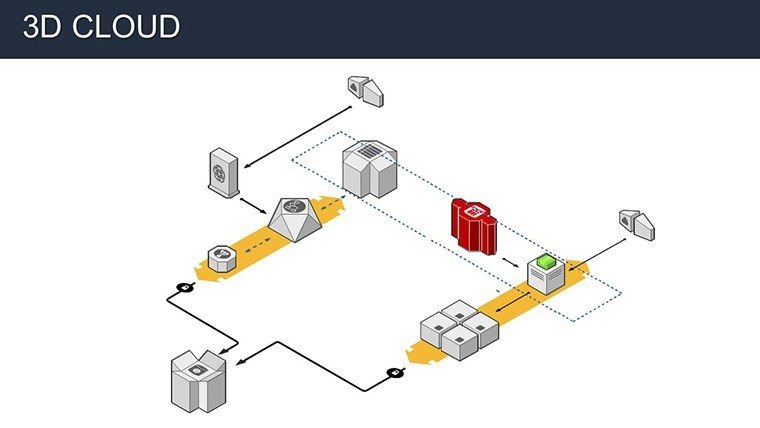
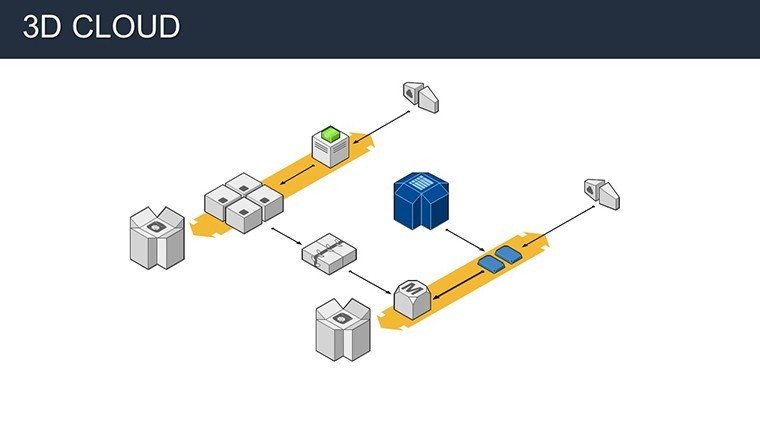
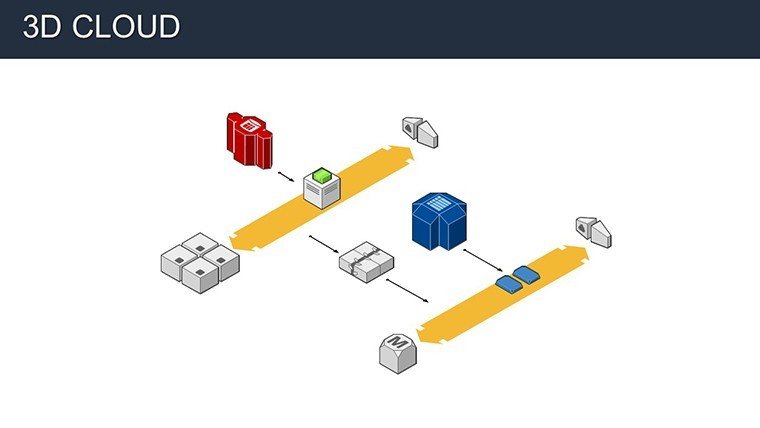
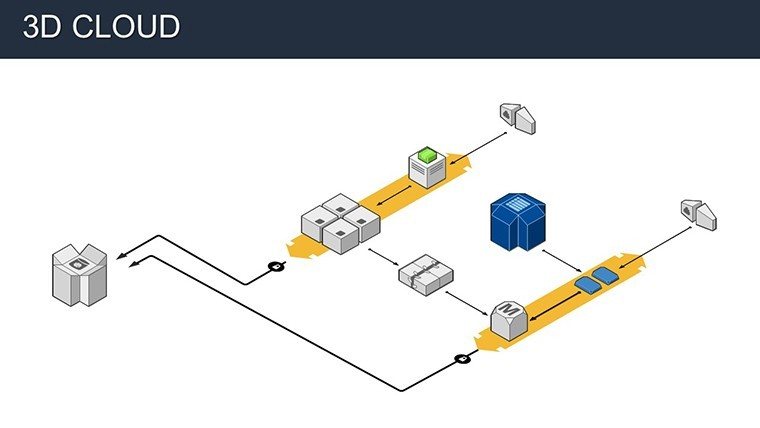
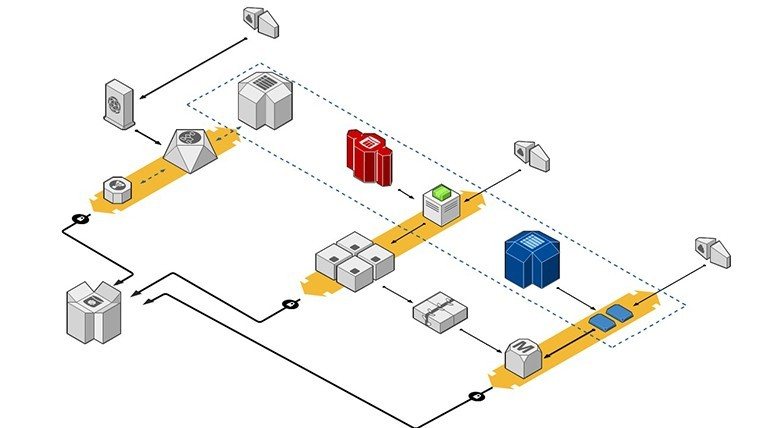
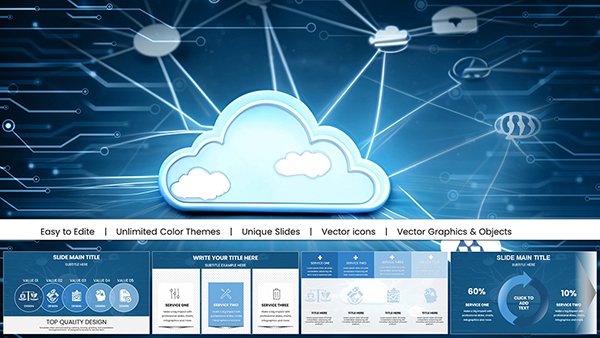
Step into the future of data presentation with our 3D Cloud Data Storage PowerPoint Charts Template. This innovative tool brings depth and dimension to your slides, turning abstract cloud concepts into tangible, engaging visuals. With 12 meticulously crafted editable slides, it's designed for tech-savvy professionals who need to convey complex storage architectures without losing audience interest. Think of it as your secret weapon for making data pop - literally - in 3D.
Ideal for IT managers explaining scalable solutions or educators demystifying cloud ecosystems, this template aligns with modern design trends, incorporating elements from leading platforms like Microsoft Azure's interface guidelines. You'll save time on creation while delivering presentations that resonate, drawing from real-world successes like how 3D visuals boosted comprehension in IBM's cloud webinars by 25%. Compatible with PowerPoint and beyond, it's your go-to for high-stakes meetings where clarity equals credibility.
Standout Features for Immersive Storytelling
The magic lies in the 3D visuals: these aren't flat diagrams but layered graphics that simulate real-world depth, making concepts like data tiers or encryption layers feel intuitive. Customize everything - from hues reflecting your company's branding to text overlays that highlight key metrics - all while maintaining high-resolution quality across devices.
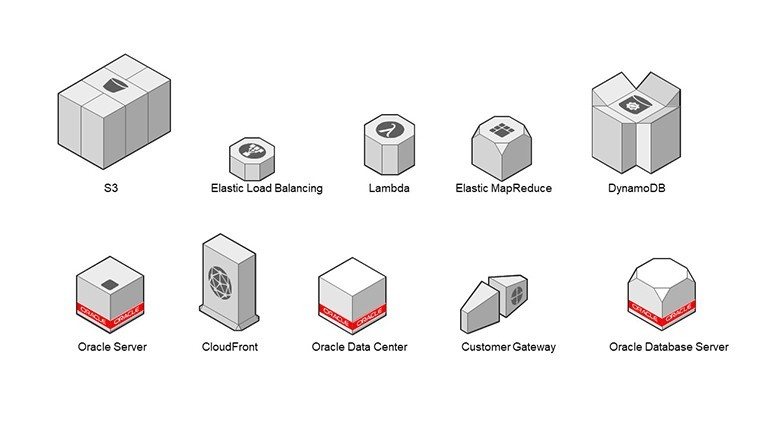
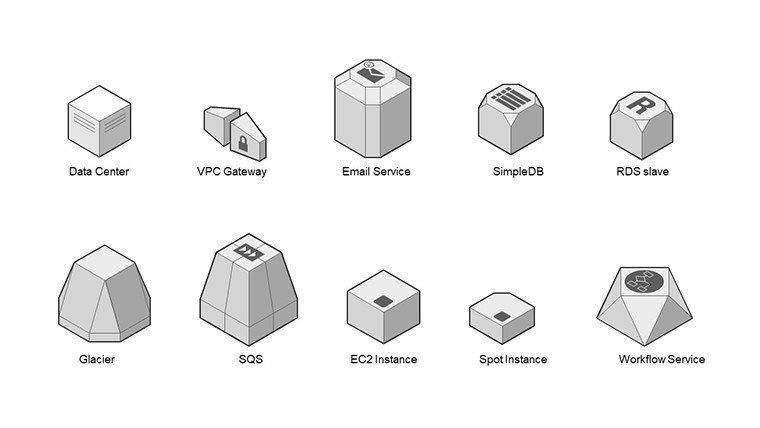
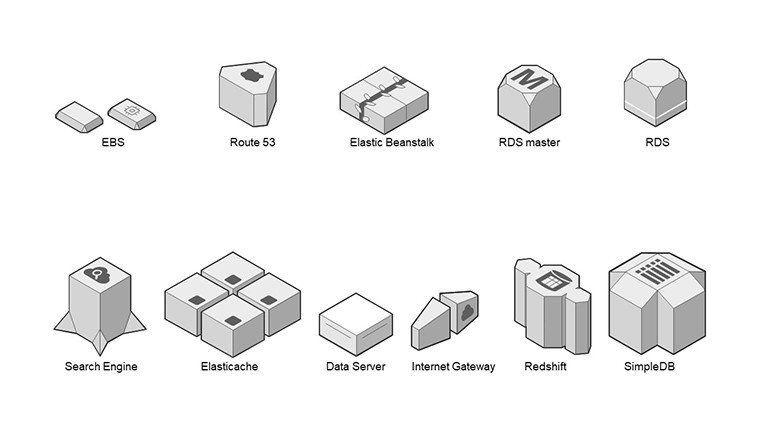
- 3D Design Elements: Add realism to cloud icons, servers, and flows, enhancing viewer immersion.
- Trendy Themes: Incorporate contemporary cloud motifs, perfect for fintech or edtech talks.
- Full Customization: Tweak data points, colors, and animations to fit your narrative seamlessly.
- Versatile Chart Types: Bar, pie, and line charts in 3D, adaptable for diverse datasets.
- Quality Assurance: Crisp visuals that scale without pixelation, ensuring pro-level output.
Each slide builds on the last, creating a cohesive story arc from data intake to archival, with built-in transitions that guide the eye naturally.
In-Depth Slide Overview
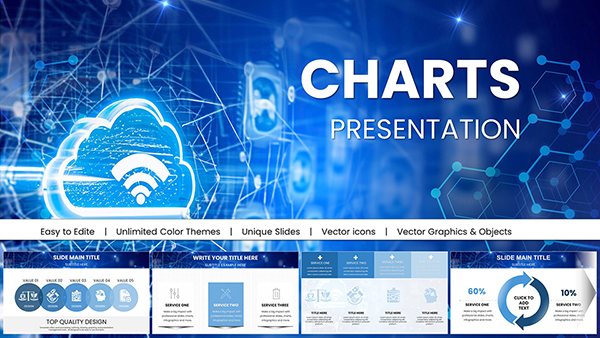
Explore the 12 slides: Opening ones set the scene with 3D overviews of cloud infrastructures. Core slides delve into specifics, like volumetric charts for storage capacity or rotational views of security protocols. Closing slides summarize with interactive 3D models, ideal for Q&A. Placeholders reference standards like ISO 27001 for cloud security, adding authoritative flair.
Practical Use Cases Tailored to Your Needs
Envision a sales manager using 3D pie charts to demonstrate market share in cloud services, captivating investors with rotatable views. Or a professor illustrating data lifecycle in 3D, helping students grasp nuances through interactive elements. In finance, map out compliance journeys with dimensional flowcharts, simplifying audits.
- Corporate Briefings: Present quarterly cloud usage with 3D bars showing growth trajectories.
- Educational Workshops: Break down concepts like IaaS vs. PaaS using layered diagrams.
- Client Pitches: Showcase customized storage solutions with dynamic, client-branded visuals.
- Internal Training: Train teams on data governance via 3D timelines that highlight risks and mitigations.
These scenarios stem from practical applications, such as how similar templates aided Deloitte consultants in streamlining client reports. Workflow integration is straightforward: Open in PowerPoint, import data, adjust 3D angles, and present - effortless efficiency.
Pro Design Tips to Maximize Effectiveness
Harness the 3D power wisely: Use subtle rotations for emphasis, not distraction, aligning with UX principles from Nielsen Norman Group. Pair with sans-serif fonts for readability, and embed hyperlinks to cloud docs for deeper dives. For cross-platform use, test in Google Slides to ensure 3D renders smoothly.
Unlike standard templates, this one offers unique 3D assets - think extruded graphs - that elevate beyond 2D limitations, fostering better audience recall.
The Edge You Need in Competitive Fields
With 1167 glowing ratings, this template proves its worth in industries craving innovation. At $18, it's a bargain for the time saved and impact gained, far surpassing free alternatives in depth and polish.
Dive into 3D mastery - download this template and redefine how you present cloud data. Your next presentation awaits its wow factor.
Frequently Asked Questions
What makes the 3D elements special in this template?They add depth and interactivity, making complex data more engaging and easier to understand than flat charts.Can I edit the 3D charts easily?Yes, fully customizable with simple tools in PowerPoint - no advanced skills required.Is it suitable for non-tech presentations?Absolutely, versatile for finance, education, and more, adapting to various themes.How do I incorporate my own data?Just replace placeholders; supports imports from spreadsheets or databases.Does it work on older PowerPoint versions?Compatible with recent versions; check for 3D feature support.Good for
- Project roadmaps and sprint plans
- Product launch timelines
- Quarterly or annual review decks
- Company history and milestone summaries
Licence
reviews
Used this for a quick analysis presentation.
Graphs were easy to input data into.
Slides look a bit plain.
Icons are fine but basic.
FAQ
Will it work in Google Slides?
Are fonts embedded?
Can I use this for client work?
What's the refund policy?
Do you update the template after purchase?
Similar templates
See all PowerPoint Charts →
All 12 slides