 Click to zoom
38 Flow Funnel Keynote Charts - Fully Editable | ImagineLayout
| Format | .pptx |
| Slides | 38 unique layouts |
| Aspect ratio | 130/73 |
| Compatibility | PowerPoint |
| Animated | No |
| Language | English |
| License | Commercial |
| File size | — |
| Version | v1.0 |
| Last updated | April 2026 |
What's inside
What is a Keynote diagram template? A Keynote diagram template is a pre-built .key file with editable charts and diagrams that open directly in Apple Keynote for fast customization in business presentations.
38 Slides, Multiple Layouts: What You Get
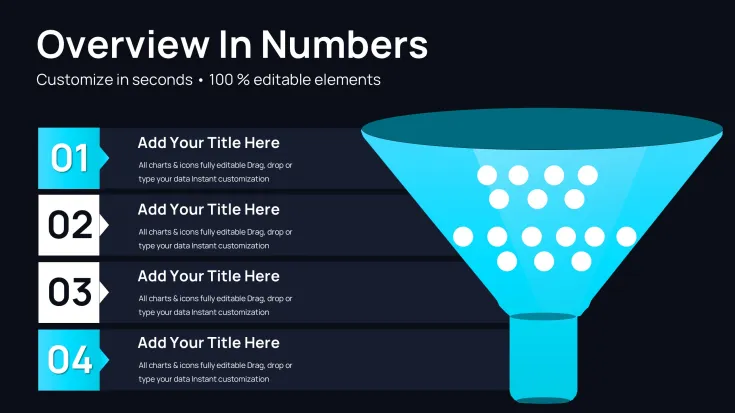
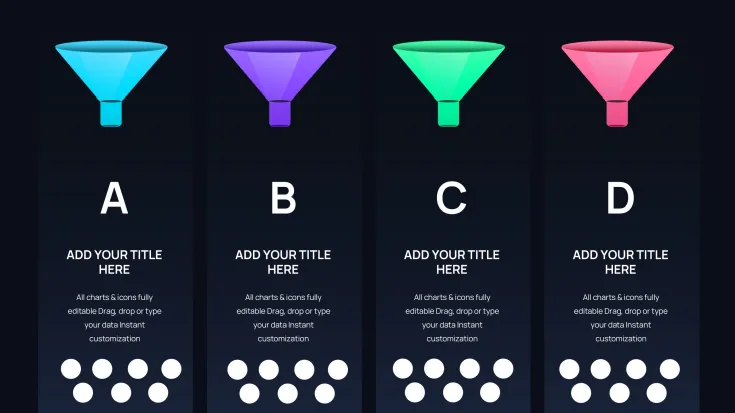
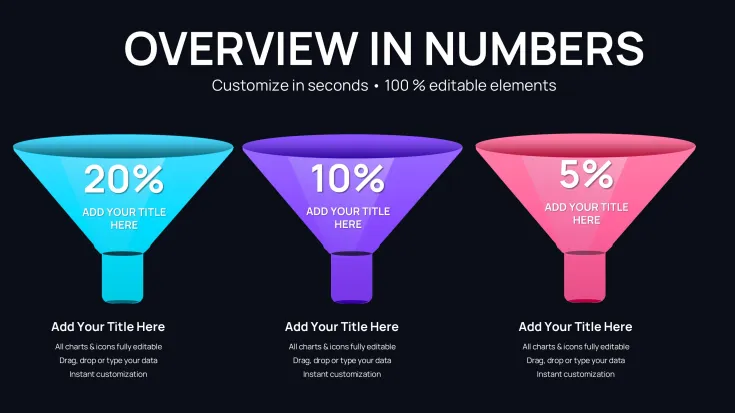
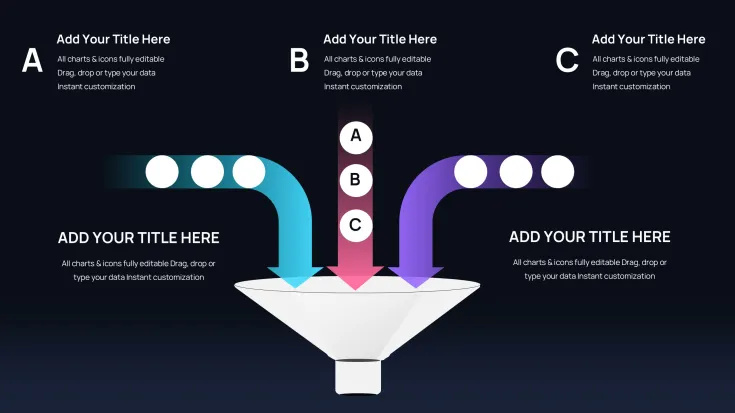
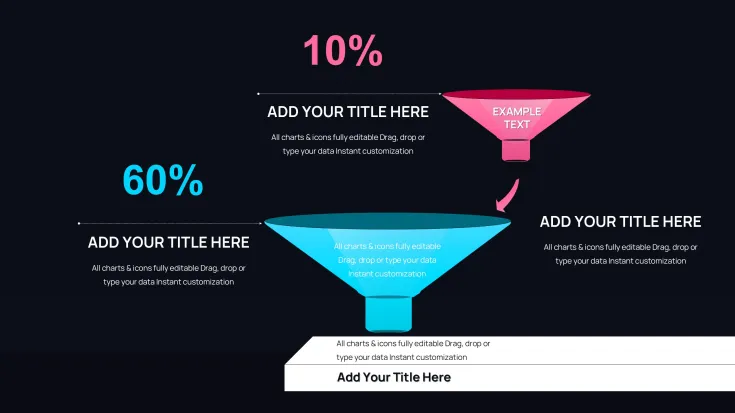
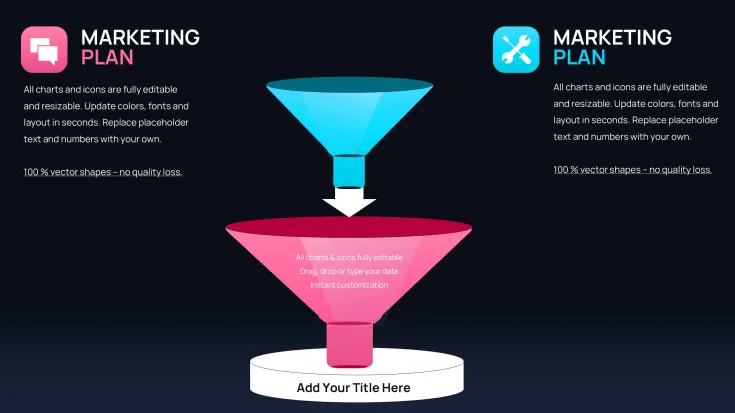
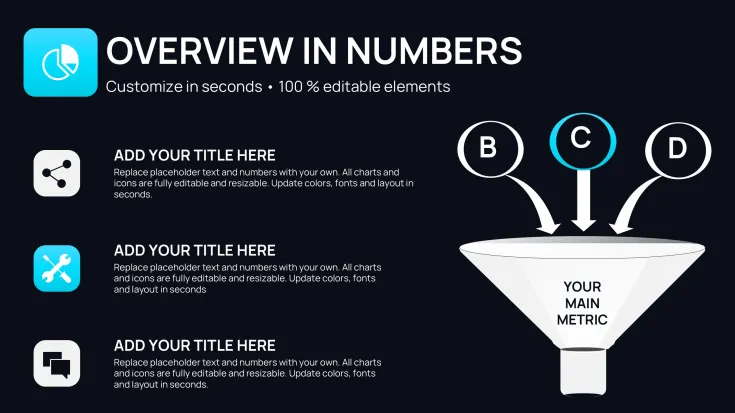
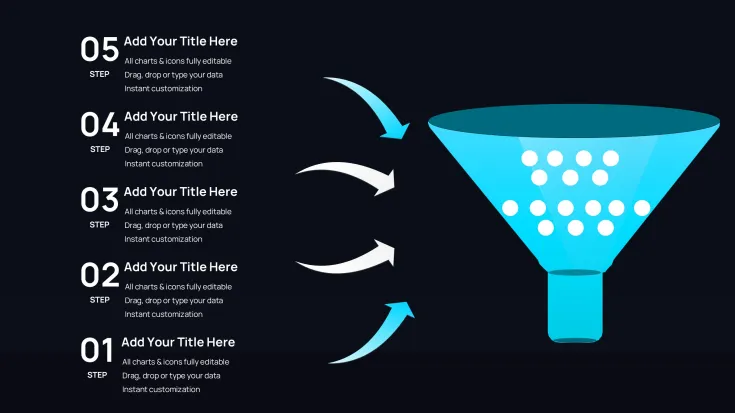
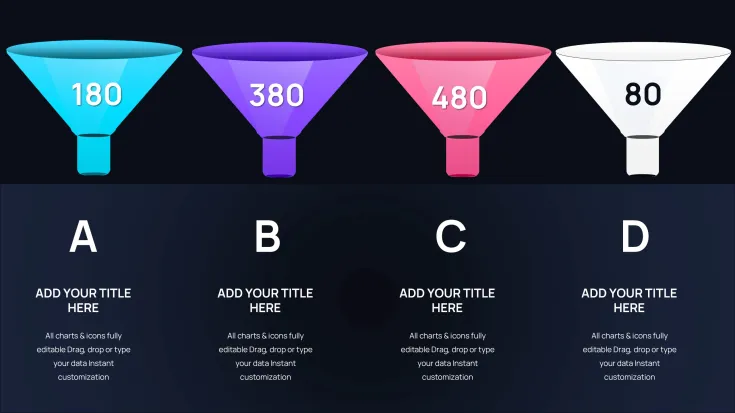
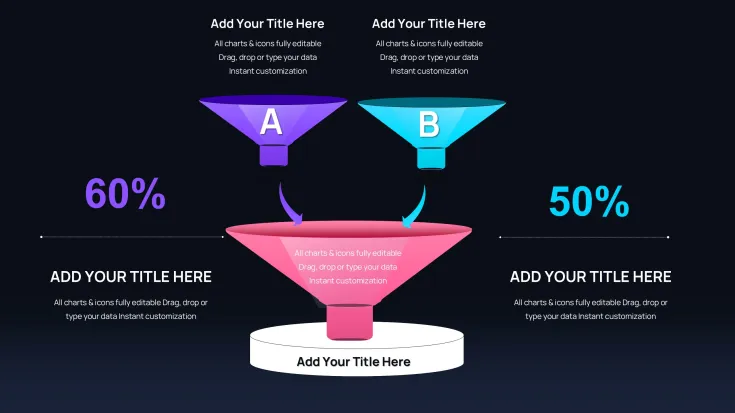
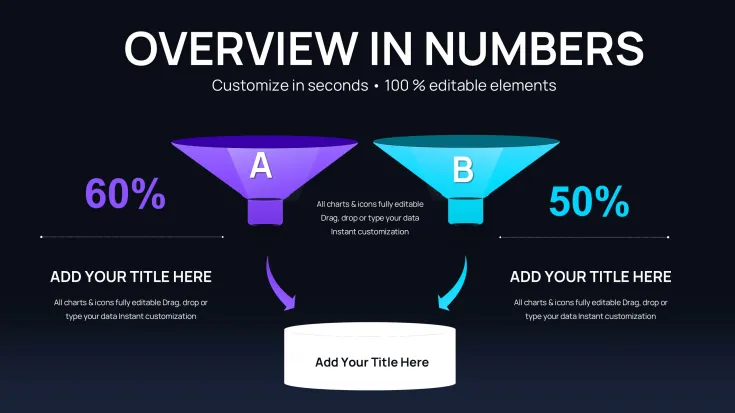
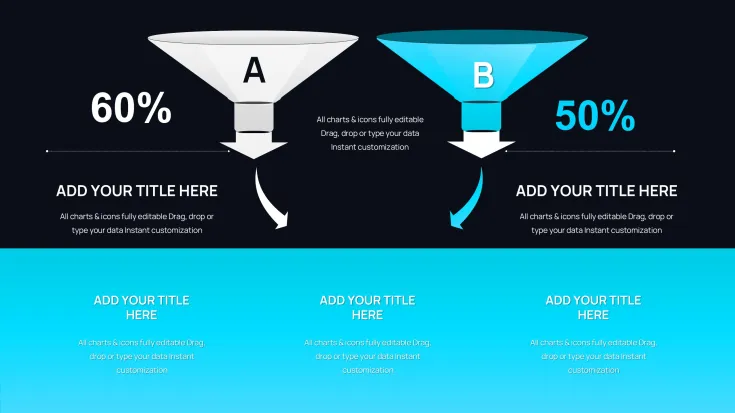
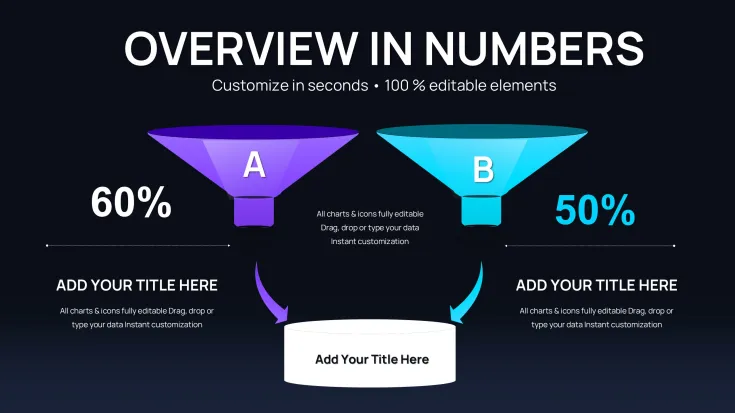
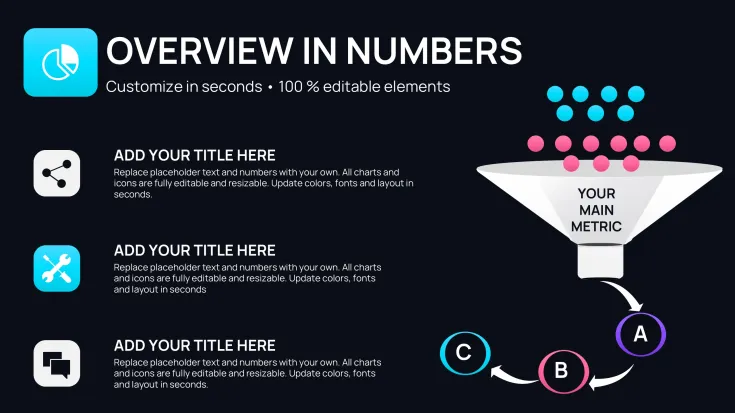
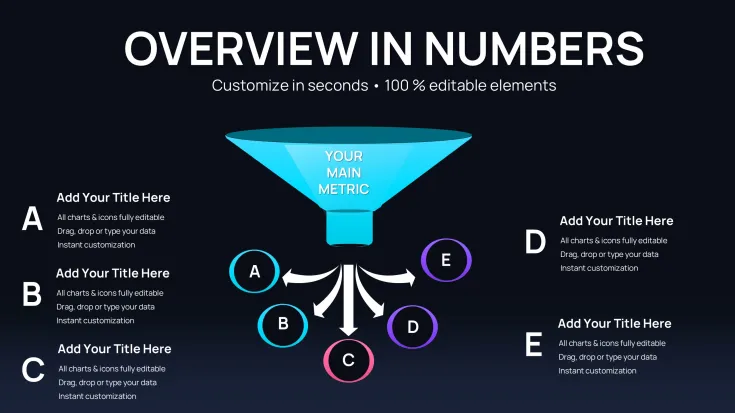
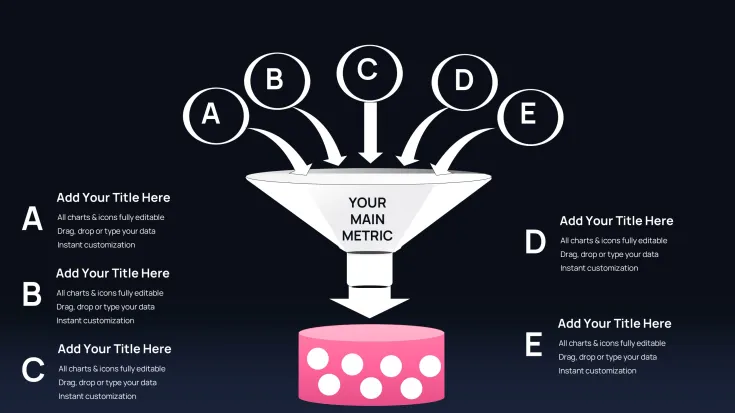
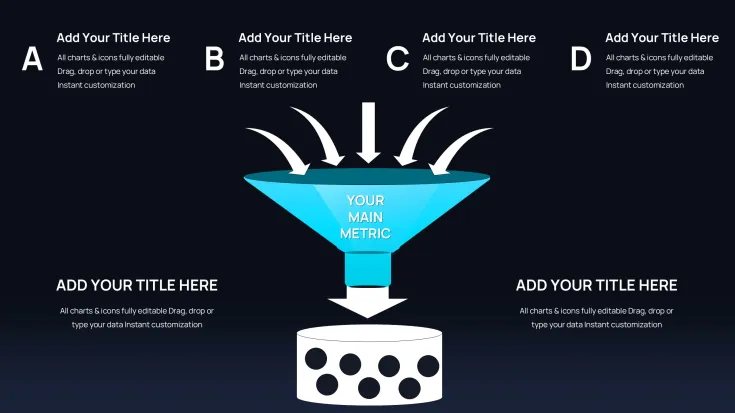
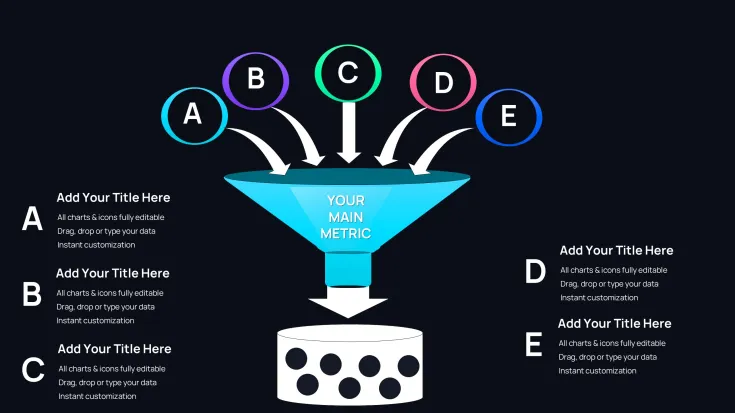
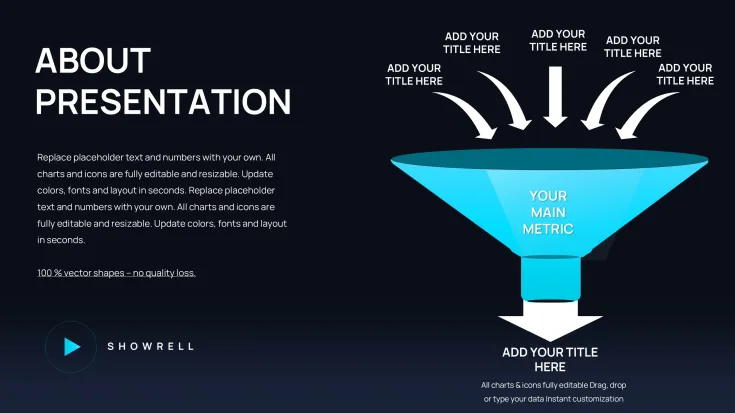
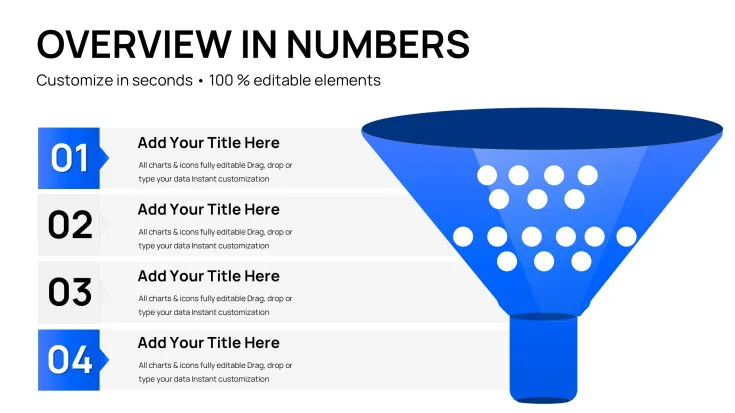
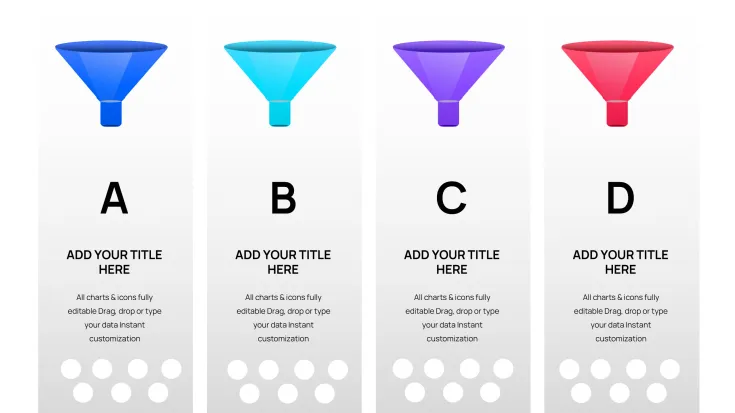
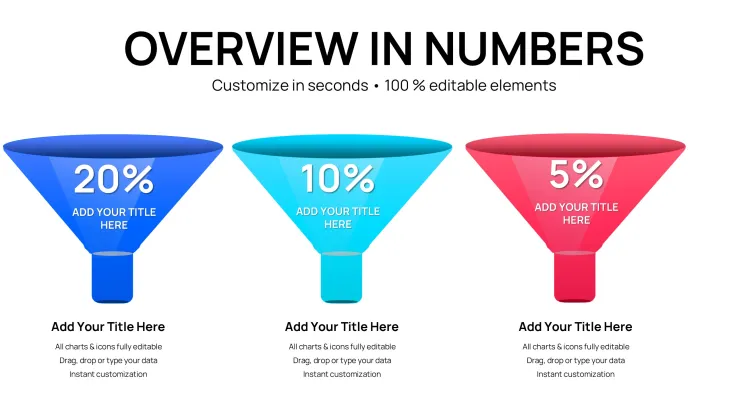
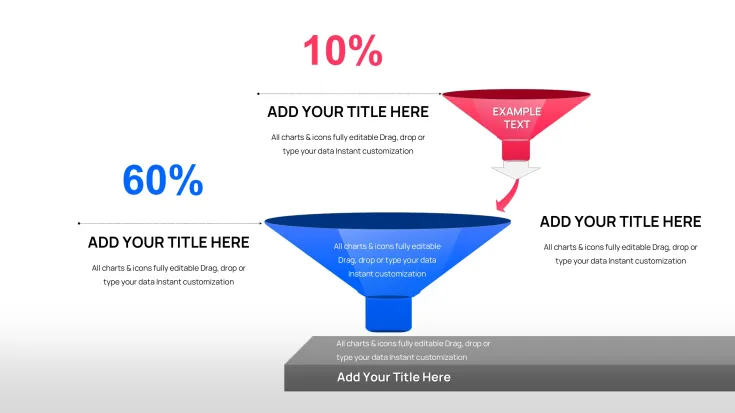
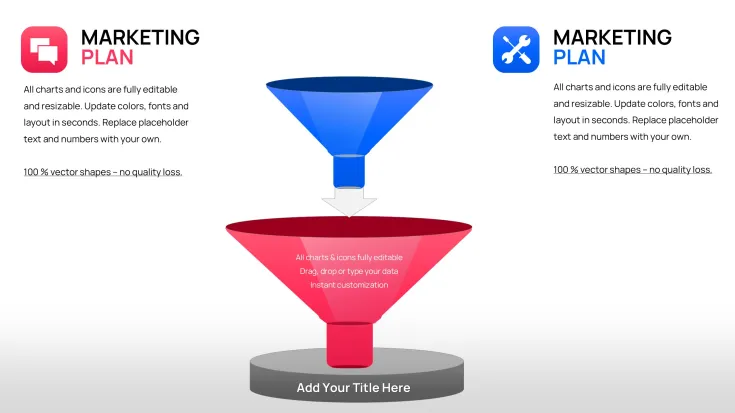
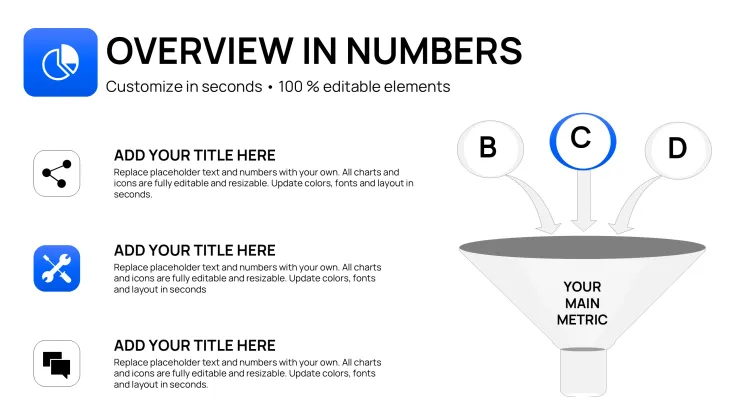
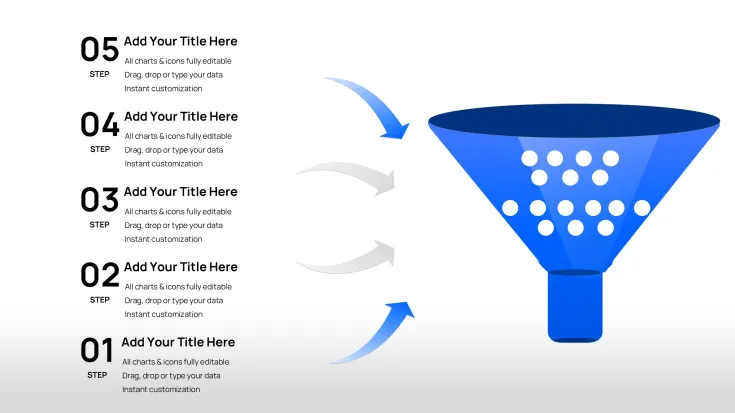
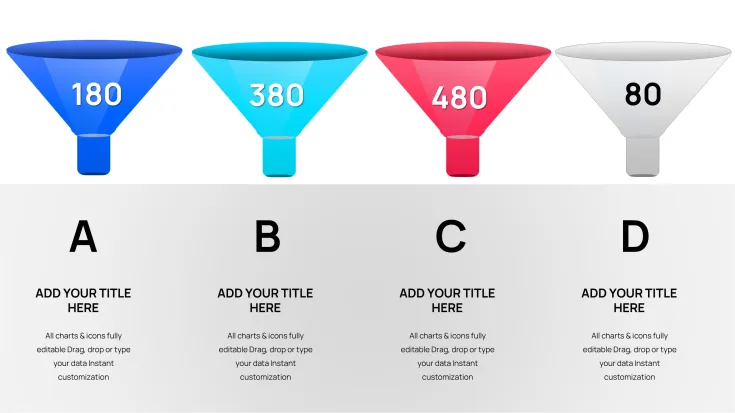
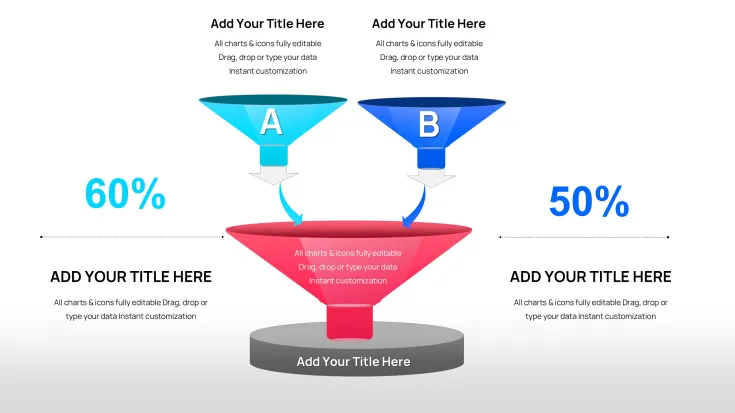
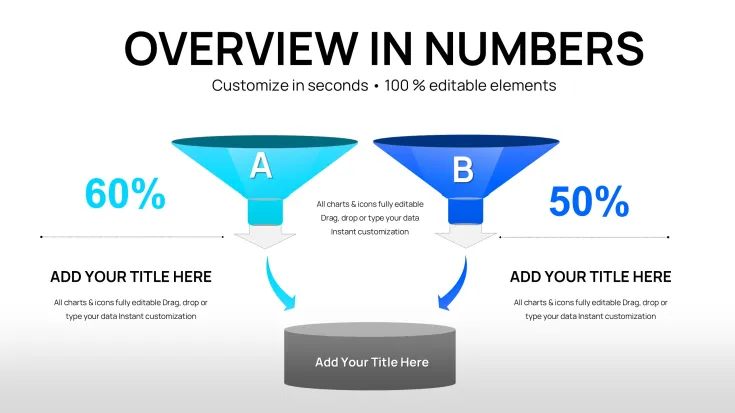
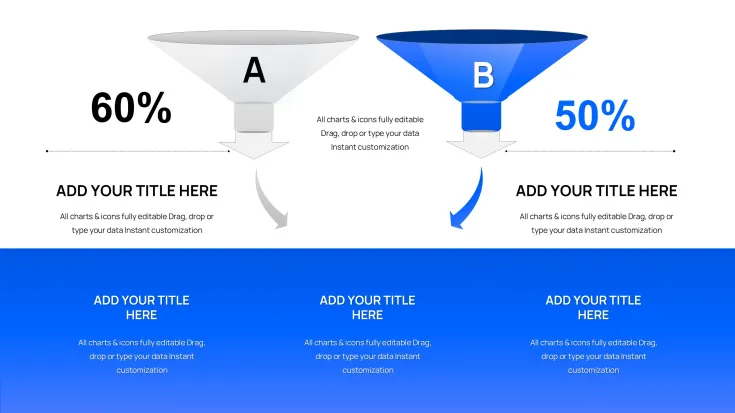
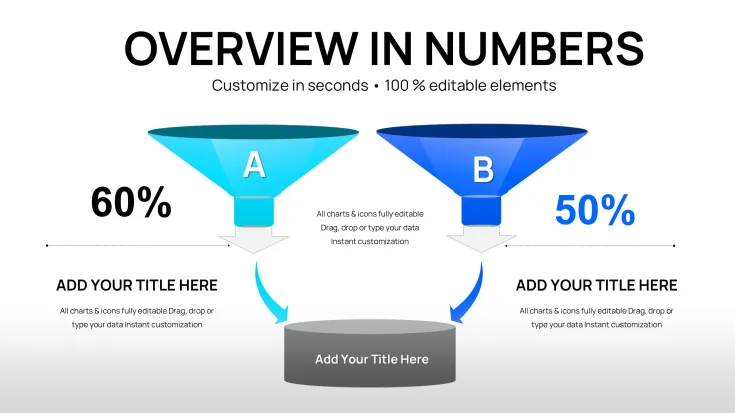
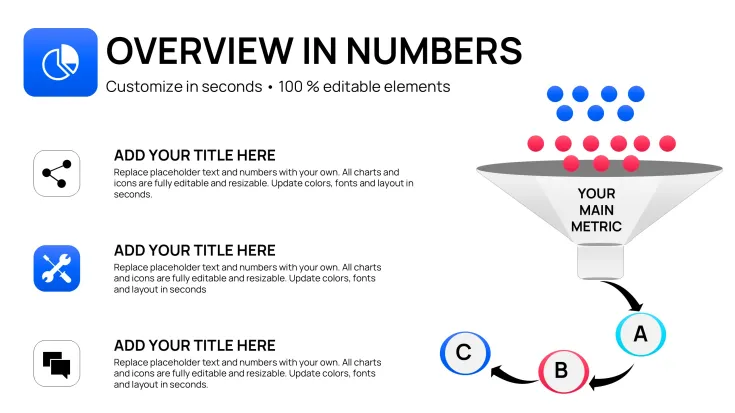
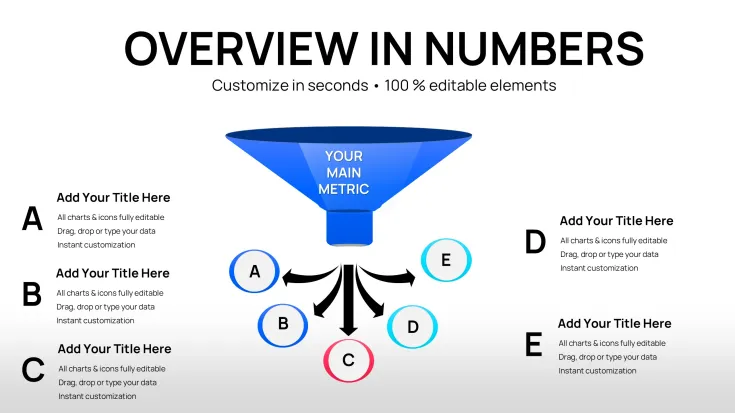
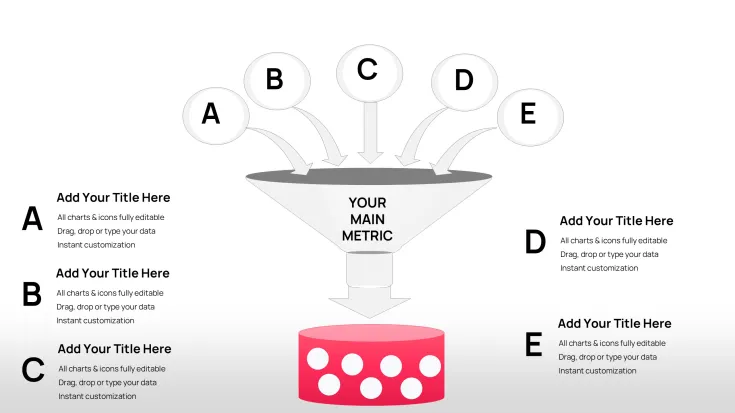
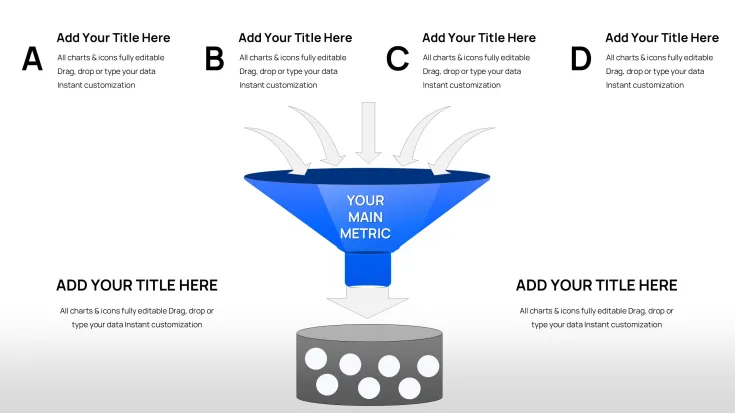
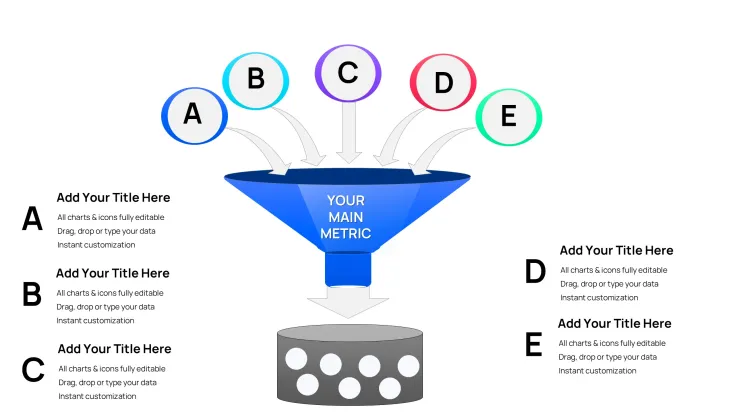
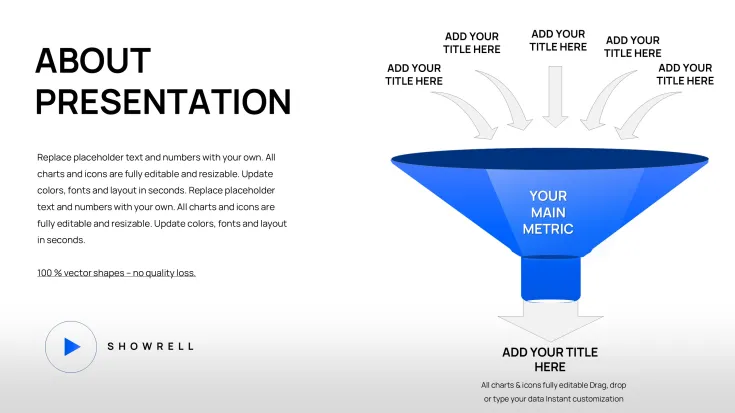
The download includes 38 editable slides packed with flow funnel charts designed specifically for process visualization.
Multiple variants let you map sequential stages show volume changes and highlight conversion metrics in a single cohesive view that supports strategy meetings or investor decks.
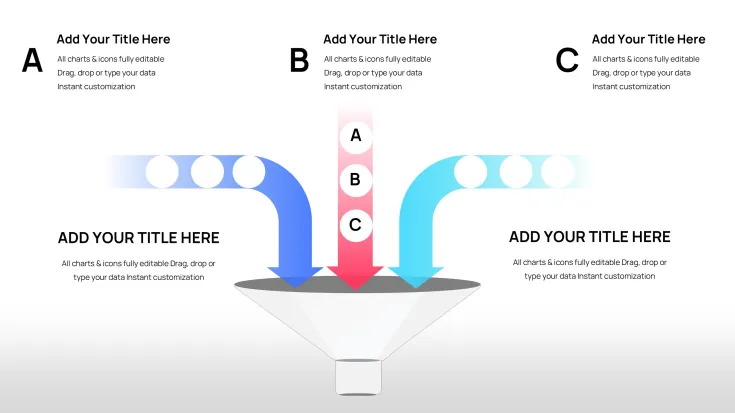
The converging funnel structure sets it apart from linear workflow sets by emphasizing drop-off rates at each level unlike single-chart layouts and enables faster audience comprehension in high-stakes sessions.
- Various funnel stage configurations for different data sets
- Vector shapes with independent segment control
- Built-in text placeholders for quick label swaps
All elements stay fully compatible with Keynote slide master updates so your entire deck maintains consistent visual hierarchy and information spacing.
Key Specifications At a Glance
FeatureDetailsSlides / diagrams included38 flow funnel charts across stage configurationsDiagram categoriesSales pipelines process flows conversion funnelsEditable elementsIndependent funnel segments resize proportionally while maintaining visual hierarchyAspect ratioStandard 16:9 for modern screensKeynote compatibility versionsKeynote 12 and later on macOSColor theme adjustmentsGlobal changes through slide master palette for consistent brandingDiagram connectorsAdjustable arrows and flow lines with variable weight and directionExport options.key for editing or PDF for final distributionReal Scenarios
Before a quarterly review a sales director at a SaaS company faced two approaches.
Before four hours spent building funnel charts from basic shapes with inconsistent alignment across slides.
After thirty-five minutes swapping data in the 38-slide set with all diagrams consistent across six client decks.
The same file was reused across three client reports by swapping color schemes.
Download and start editing immediately
Customization in 5 Steps
Moderate skill level.
- Open the .key file in Keynote 12 or later (1 minute)
- Replace placeholder text and update funnel data labels (3 minutes)
- Adjust color theme via the slide master to match your brand palette (2 minutes)
- Resize or reorder funnel segments as needed for your specific process (4 minutes)
- Export to PDF or keep in .key for live edits (1 minute)
How to update funnel data
Select the funnel group on the slide then double-click any data label to edit values directly.
- Keynote recalculates segment sizes automatically based on new numbers.
- Adjust connector weights through Format - Shape Style if flow direction changes.
- Preview the slide master to confirm color contrast remains clear across all 38 slides.
- Save and test in presentation mode before the strategy meeting.
Why This Template, Not a Blank Slide
Building equivalent flow funnel charts from scratch takes over four hours and demands advanced shape alignment skills.
Manual construction often leads to misaligned connectors that shift during resizing or inconsistent spacing that disrupts flow direction.
Funnel layers use converging boundaries to encode volume reduction visually - the narrowing shape itself signals conversion drop-off before any numbers appear allowing audiences to grasp the story at a glance in board briefings.
- Broken visual hierarchy when segments do not scale proportionally
- Color contrast failures that hide key stages on projection
- Time lost fixing layout composition across multiple slides
This Keynote diagram template avoids those issues entirely and keeps focus on your message in consulting decks or sales presentations.
Download and start editing immediately
For more process visuals explore the flow keynote charts templates category.
Teams needing staged drop-off analysis can also review options such as the Business Timeline Keynote Template for linear flows.
Ring-based alternatives appear in the Dynamic Flow Rings Keynote Charts Download when circular layouts suit your data better.
Which Keynote versions does this template support?The template works in Keynote 12 and all later versions on macOS. Earlier releases may show layout shifts because some shape style features were introduced in version 12. Open the file directly after download and Keynote will prompt for any missing updates. Test one slide first to confirm full diagram connectors and color theme adjustments display correctly before editing the full 38 slides.
How do I change the color scheme step-by-step via slide master?Open View - Master Slides then select the master layout used by the funnel charts. Update the fill colors of the placeholder shapes there and the changes apply globally across all 38 slides. Individual overrides remain possible on any slide without affecting the master. Save the file once complete and the new palette stays locked for future strategy meetings.
What does the license allow for client work and internal use?The license permits both internal company use and paid client work with the purchased file. You may not resell or redistribute the original .key file as a standalone product. Multiple team members within the same organization can share the single license. Contact support if your use case involves external agencies beyond standard client deliverables.
What are the differences between free and paid versions?The page offers only the paid version at $18 which includes the complete set of 38 editable slides. No free tier appears in the product specifications. Paid access unlocks the full file with all diagram connectors and master layouts. The paid version also guarantees immediate download without watermarks or restricted editing.
What is the refund policy?Refunds are available within 14 days of purchase if the .key file does not open correctly in your version of Keynote or if the diagrams fail to edit as described. You must provide proof of the compatibility issue before a refund processes. Refunds do not apply after the file has been modified or integrated into a deck. Contact support with your order number to start the process.
How do I update chart data in the funnel diagrams?Select any funnel segment group on the slide then double-click the data labels to enter new values. Keynote automatically adjusts segment widths based on the updated numbers while preserving layout composition. Repeat for each stage and preview the flow direction to ensure readability. Save the master changes if you want the update to carry over to similar slides.
How do I export the presentation for different destinations?Go to File - Export To then choose PDF for client distribution or PowerPoint if the recipient uses Microsoft tools. For web sharing select the interactive export option that preserves clickable elements. Always check color contrast after export because some formats flatten gradients used in the funnel layers. Keep the original .key file for ongoing edits.
Good for
- Project roadmaps and sprint plans
- Product launch timelines
- Quarterly or annual review decks
- Company history and milestone summaries
Licence
reviews
The hub-and-spoke configurations with labeled nodes made the partner integration model easy to explain and my client actually understood the dependencies.
Used the bilateral tree structures for a stakeholder influence map and the airy spacing kept everything readable when projected on a large screen.
Good for business development teams but the slide master color-switch mechanism isn't listed anywhere on the page so I had to update fills one by one.
The .key file worked fine on my Keynote 12 and the 44 editable slides covered everything I needed for a strategy presentation.
Decent for the price but next time I'll look for something with global color updates because updating each node individually took extra time.
FAQ
Will it work in Google Slides?
Are fonts embedded?
Can I use this for client work?
What's the refund policy?
Do you update the template after purchase?
Similar templates
See all Keynote Charts →
All 38 slides